 Managing large amounts of data presents biopharmaceutical companies of all sizes with the need to adopt more efficient ways to handle the ongoing influx of information. At KNect365’s September 2017 Cell and Gene Therapy conference in Boston, Lisa Graham (founder and chief executive officer of Alkemy Innovation, Inc. in Bend, OR) spoke about the need for data management, data analysis, and process monitoring systems to evolve. Although she was speaking at a cell therapy event, her points are applicable to the biopharmaceutical industry at large — which can learn a great deal overall from data management practices in other industries.
Alkemy Innovation is an engineering company delivering science-based solutions in business/engineering intelligence and strategic data acquisition and process analytical technology (PAT). In a recent eBook for BPI, Graham examined how different software and hardware applications can provide required scientific insight for success with bioprocessing in two industries: brewing and biopharmaceuticals (1). Techniques for developing both PAT and novel data analytics approaches could cross over between those two. After the conference session in Boston, we spoke about the topic of “big data” in more depth. Highlights of our conversation follow.
What We Measure and Why
Whether a company is creating cell/ gene therapies or other categories of products, your presentation emphasizes that the first step is to determine what should be measured and why. What information is important, how is that information stored for later access, and how can it be analyzed? “We don’t necessarily look for a single answer regarding what software to use,” Graham said. “Instead, we need to develop a strategy or methodology for how to analyze information. Whether we’re brewing beer or creating medicines for injection — or even creating some foods — the biotechnology industry needs an optimized PAT coupled with comprehensive data analytics. Companies should develop such a strategy after they define the product quality attributes (PQAs) that they want to understand. They can use tools to develop functionality in the chemistry or the biology at work with their processing environments.”
She went on: “PATs provide part of that functionality, but a core important determination is how to couple PAT with a comprehensive data analytics application. Without a fundamental understanding of your bioprocess, you cannot achieve desired PQAs consistently. And whether your cells are making a protein or just increasing their own numbers, a centralized manufacturing model can be applied across the board to apply what we learn from other industries.”
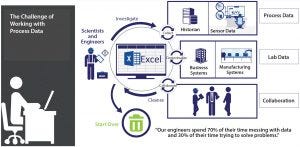
Figure 1: The challenge of working with process data
How does that differ from traditional approaches driven by empirical data collection and business needs? Graham recalled, “Before the advent of cloud computing and our ability to take advantage of high-throughput screening, the biotechnology industry brought quite a few PAT tools into practice: sensors and other technologies for measuring parameters in real time, for example. We would look at the big ‘lake’ of data we generated, then decide from that what it tells us, and then figure out what our insights are” (Figure 1).
“But with PAT, cloud storage, and a wealth of high-throughput data,” she continued, “we approach the situation in reverse: beginning with the insight that we need and what information will provide that for us, then using that set of expectations to help us
choose our PAT. If you look at it that way, then perhaps it is no longer a ‘big-data’ problem but a matter of selectively gathering the data we plan to use. Of course, we don’t always know what insights we’re looking for. We need a way to go down that path
quickly without a lot of cutting and pasting of process data into spreadsheets.”
Spreadsheets are still ubiquitous in bioprocess development. “Yes,” Graham said, “and those can be a disaster. Somebody once joked that spreadsheets are like rabbits: They multiply rapidly until you’re wading through a sea of them, and nobody knows where they are going or where they went. Add to that the challenges that come with collaboration, compounded by how frequently people change jobs in this industry, and you see that this is not a sustainable solution. Even many financial organizations and finance officers are urging a move away from spreadsheets. It’s time to use something better.”
So it sounds like you are encouraging a change in human behavior toward acceptance of a topdown approach. “Yes,” Graham confirmed. “To illustrate this, I
generally ask my audience how many people have fitness programs (or think they should). In a fitness program, our ‘PQAs’ are ourselves as related to our activity and our field and our genetics. It’s actually analogous.
“In my case,” she explained, “I started a new fitness program: I went out and started running, ran a few laps, and came home. Then what did I do? I opened up an Excel sheet to keep track of my laps with some details, and I continued that for a few weeks. As I started to progress to running one mile, then two miles, then five kilometers, I wished I had gathered more information in my spreadsheet. There were new questions
I wanted to ask about my progress, but I couldn’t because I hadn’t bothered to record the data. And then I started to see errors in the spreadsheet because I knew I didn’t run 25 miles, but that’s what the spreadsheet indicated.
“So when someone says to me, ‘I can use Excel with all my templating to handle my data,’ I know that such tracking systems are unsustainable and can become unreliable over time. Particularly when the number of experiments increases and the need to
overlay your breadth of experience develops, you need a more facile solution than trying to combine multiple spreadsheets. Without a real solution, we simply won’t ask the questions that we should ask.”
Recalling her own fitness example, Graham pointed out, “For the whole time I was doing my running program, I had a Fitbit device sitting next to my desk in a box. And I was too hesitant to change, to open it up and learn about the technology and use it. So when I reached the point of losing interest in keeping my spreadsheet updated with all its errors, I finally put the Fitbit on and — wow — now I didn’t have to do anything after I ran. I eliminated work, and I could instantly see the results of what I was doing. I even started analyzing my progress differently because it was so easy to model the data. So this underscores the importance of using the right tool and accepting that it could require a change in behavior. Effort today brings a big payoff tomorrow.”
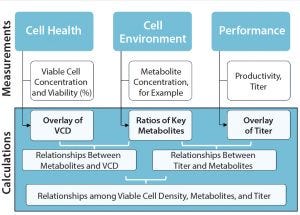
Figure 2: A data analytics framework can provide access to discrete–time-point, batch data sets for analysis; VCD = viable cell density.
How We Store It
So data storage and connectivity systems are needed to collect information for a customer’s project. Do those include visualization? “Even though some programs offer visualization or trending of charts,” said Graham, “unless you collect all your data into databases and/or data historians, you’re still missing that ability to connect what you’re measuring from offline analytical instruments with what the online sensors measure. For a complete strategy, you need data storage that captures the metadata about an experiment, too, perhaps in an electronic laboratory notebook (ELN) or other application. But that is only part of the solution. You may have a data historian and ELNs, but without those sources connected to one another, you are missing the big
picture” (Figure 2).
How we Analyze It
Graham explained that at the start of a project, she helps a client company take stock of what it wants to accomplish and what programs already are in place for gathering the
necessary information. Working from client spreadsheets, she can help engineers create process models and develop insight into what should be measured and how. But for longer-term solutions, she encourages companies to redefine their workflows and data-analytics strategies for gaining new insights into the products under development through iterative data interaction.
“One example is the Seeq data analytics application with its Biotech Lab Module feature,” she said (www.seeq.com/about). “This is a batch-focused application that we use to connect different data sources so that pharmaceutical scientists and biologists
can perform rapid ad hoc interactive analyses without needing to hire additional data analytics experts. The program gives everyone the necessary historical information in a single environment” (see the “Framework” box). “We use such tools to assemble
and contextualize data, which then enables an interactive investigation and real-time collaboration with colleagues who have developed other data sets. And of course it’s important to be able to monitor, publish, and share your results. Contrasting with the
proliferating spreadsheet system, here all the information resides in a centrally available location. And analysts can continue to use sophisticated visualization software (e.g., Tableau or Spotfire) if they want to.
Case Studies: Toward Improving Business Value
The “Business Value” box offers examples of benefits biopharmaceutical companies might realize through implementing a big-data strategy. Graham typically begins by helping her clients assess their goals: Do they want to integrate upstream with downstream bioproduction? Do they need to minimize the waste spent in bioprocessing or set up remote monitoring? She emphasizes that this is not a new approach: Other industries use scalable data analytics and visualization software already, in some
cases (e.g., the oil and gas industry) on a far grander scale. “Can you imagine
trying to monitor a thousand oil wells using spreadsheets?” she asked.
“The first example of the approach that we take is from work done with Merrimack Pharmaceuticals” (2, 3). The company had scaled up production, and all results looked good when it produced its good manufacturing practice (GMP) batch at 1,000-L scale.
“The team saw excellent viable growth in the cells. Everything looked wonderful. But then, the downstream group said that the protein was not high-enough quality to proceed to the clinic. That group saw aggregation, among other issues, which emphasizes the point that you can’t just judge success based on one half of your
process. Development and manufacturing groups tend to be fractured from each other.”
To troubleshoot the problem, Merrimack needed to conduct a number of benchtop experiments. “Using a spreadsheet approach, this would have involved cutting and
pasting in Excel documents, taking measurements of cell health that come from one offline device and adding cell environment measurements from another offline device, as well as adding performance for the measurement of protein productivity and titer, then overlaying all that with real-time processing data.” If all those measurements are pasted into a Microsoft Excel file from thumb drives and other spreadsheets, none of
the timestamps will be aligned because they come from different times and places.
“And what if you have 20 bioreactors?” Graham posited. “A company shouldn’t have to do all that prework. The rate at which new medicines are developed is bottlenecked not only by the time it takes for people to cut and paste in spreadsheet files, but also because it is too difficult to overlay, say, the past six months of bioreactor information
for a certain cell line and see what can be learned from those data. So people are not asking the questions they need to because they don’t want to be immersed in manually integrating all that information.”
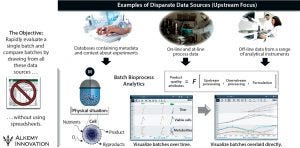
Figure 3: Integrating disparate data sets — upstream/production examples
In the case study, the upstream group saw positive signs before the downstream group detected the problem — but troubleshooting was complicated by the need to assess data from six bioreactors, 14 individual sample points, several offline pieces of analytical equipment, and thousands of online trending data points — all manually handled in Excel spreadsheets (Figure 3). By contrast, Figure 4 charts an approach using a data-analytics framework providing access to discrete time-point batch-data sets. It takes the click of two or three buttons to calculate what is happening inside a given bioreactor and/or downstream purification process and export those results — instead of needing to find where the data are sitting, then copy and paste them manually (with an inherent potential for error).
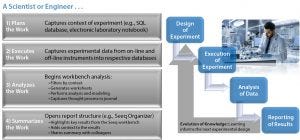
Figure 4: Case study: overview of a scientist or engineer’s workflow…
“In this project,” Graham said, “we used offline data for viability, metabolites, and titer measurements, as well as on-line process data from an Emerson DeltaV data historian. In essence, this was a scale-down study to assess the impact of media changes on cell growth and productivity to help us understand the science of the process and enable a successful technology transfer back to the 1,000-L bioreactor scale for GMP manufacturing. As the scientists executed the work, they captured experimental data from online and offline instruments, all of which were read into the data analytics application for analysis and sharing with colleagues.”
I commented about legacy issues and the fact that this new approach will keep all of a company’s data in a much more accessible format rather than forcing future engineers to go back through 20-year-old spreadsheets. “And the raw data are preserved,” Graham added, “so you can indeed go back to do whatever you needed to do from a filing perspective or apply lessons learned.”
Her next example concerned a research focus area in which scientists routinely perform screening assays to optimize media or cell-line performance. Here the Seeq-based
Biotech Lab Module feature applied with design of experiments (DoE) to compare performance among different media-development assays. “In this project,” she said, “we used offline data for viability, metabolites, and titer measurements. Imagine the ability to
look at not only one assay with 24 centrifuge tubes or 96 plate wells, but also to overlay assays performed across time. A scientist can select a cell line or media component of interest, then let the application filter everything related for him or her to analyze and
then share learnings without hours spent on spreadsheets.”
In such an approach, metadata capture is key for context of the work. “For example,” Graham said, “an ELN network or database can capture what is done and why with the names of project members involved, lot numbers, cell-line information, observations, and conclusions — all important information that could be needed later.”
“An automated system removes the need for individual templates,” Graham pointed out, “creating thumbnail views for all the data that team members have chosen to look at.
They can compare cell growth curves, for example, with metabolite concentrations or titer levels from a central set of experimental data.”
Thinking About the Entire Data Analytics Experience
Graham concluded our conversation by noting that the biopharmaceutical industry is very interested in knowledge management right now. And it ought to address the
operational side, choosing optimal data processing and analysis technologies and ensuring scientific leadership throughout bioprocessing. She emphasized that successful knowledge management is a team effort, requiring acceptance of new
tools that streamline access to the growing amount of data accumulating throughout a product’s life cycle.
Strategies exist to address large-scale data processing and analysis needs in the realm of biopharmaceutical development. Options are available to support immediate action for bringing in solutions that can improve the pipeline now while providing flexibility for future changes. An important aspect of implementing data processing and analysis includes defining a strategy in which the scientific community can take a lead role in
strong partnership with information technology professionals.
References
1 Graham LJ. Of Microbrews and Medicines: Understanding Their Similarities and Differences in Bioprocessing Can Help Improve Yields and Quality While Reducing
Cost. BioProcess Int. eBook 8 February 2018: www.bioprocessintl.com/upstream-processing/fermentation/microbrews-medicines-understanding-similarities-differences-bioprocessing-can-help-improve-yields-quality-reducing-cost.
2 Graham LJ. Deriving Insight at the Speed of Thought. Bioprocessing J. 16(1) 2017:
32–41; doi:10.12665/J161.Graham.
3 Barreira T. Merrimack Pharmaceuticals, When Novel Molecules Meet Bioreactor
Realities: A Case Study in Scale-Up Challenges and Innovative Solutions. ISBioTech Conference: Virginia Beach, VA, 12 December 2016.
Further Reading
Brown F, Hahn M. Informatics Technologies in an Evolving R&D Landscape. BioProcess Int. 10(6) 2012: 64–69; www.bioprocessintl.com/manufacturing/information-technology/informatics-technologies-in-an-evolving-randd-landscape-331164.
Chviruk B, et al. Transforming Deviation Management. BioProcess Int. 15(8) 2017: 12–17; www.bioprocessintl.com/business/risk-management/transforming-deviation-management-biophorum-operations-group.
Fan H, Scott C. From Chips to CHO Cells: IT Advances in Upstream Bioprocessing.
BioProcess Int. 13(11) 2015: 24–29; www.bioprocessintl.com/manufacturing/information-technology/from-chips-to-cho-cells-it-advances-in-upstream-bioprocessing.
Moore C. Harnessing the Power of Big Data to Improve Drug R&D. BioProcess Int. 14(8) 2016: 64; www.bioprocessintl.com/manufacturing/information-technology/harnessing-power-big-data-improve-drug-rd.
Rekhi R, et al. Decision-Support Tools for Monoclonal Antibody and Cell Therapy
Bioprocessing: Current Landscape and Development Opportunities. BioProcess Int.
13(11) 2015: 30–39; www.bioprocessintl.com/manufacturing/monoclonal-antibodies/decision-support-tools-for-monoclonal-antibody-and-cell-therapy-bioprocessing-current-landscape-and-development-opportunities.
Rios M. Analytics for Modern Bioprocess Development. BioProcess Int. 12(3) 2014: insert; www.bioprocessintl.com/manufacturing/information-technology/analytics-for-modern-bioprocess-development-350507.
Sinclair A, Monge M, Brown A. A Framework for Process Knowledge Management. BioProcess Int. 10(11) 2012: 22–29; www.bioprocessintl.com/manufacturing/information-technology/a-framework-for-process-knowledge-management-337778.
Snee RD. Think Strategically for Design of Experiments Success. BioProcess Int. 9(3)
2011: 18–25; www.bioprocessintl.com/upstream-processing/fermentation/think-strategically-for-design-of-experiments-success-312282.
Whitford W. The Era of Digital Biomanufacturing. BioProcess Int. 15(3) 2017:
12–18; www.bioprocessintl.com/manufacturing/information-technology/the-era-of-digital-biomanufacturing.
S. Anne Montgomery is cofounder and editor in chief of BioProcess International, [email protected]. Lisa J. Graham, PhD, PE, is founder and chief executive officer of Alkemy Innovation, 63527 Boyd Acres Road, Bend, OR, 97701; 1-541-408-4175; www.alkemyinnovation.com.


