Conjugated protein biotherapeutics such as PEGylated proteins (with polyethylene glycol), antibody–drug conjugates (ADCs), and protein–haptens often present unique analytical challenges related to characterizing the conjugation aspect of their manufacturing processes. Analytical characterization of this class of proteins requires knowledge of the sites of conjugation, the degree of conjugation, and the drug-to-protein ratio.
Here we present case studies in development of reliable methods based on mass spectrometry (MS) to characterize a protein–hapten drug substance during late-phase process validation. This protein is modified by succinylation to enable conjugation with an aminated hapten.
The Challenge
Haptens are small molecules and usually by themselves nonimmunogenic. They must be attached to a macromolecule (e.g., protein, peptide, or synthetic polyamino acid) to solicit a hapten-specific immune response. In our case study, a client required an accelerated 16-month program for technology transfer and conformance manufacturing of a hapten-conjugated protein drug substance. This project required transfer of a validated recombinant protein expression and production process as well as characterization of hapten conjugation. We needed to develop and qualify analytical methods to monitor conjugation during validation of the recombinant protein–hapten conjugate manufacturing process.
A common hapten-conjugation chemistry involves succinylation of protein amino groups followed by covalent attachment of the aminated hapten to the succinyl group. Chemical derivatization of proteins to form bioconjugates is a common process in biotechnology, but characterization of such bioconjugates remains a challenge. Several classical methods have been used to estimate the degree of protein succinylation, typically using spectroscopy to assay for unreacted amino groups on a protein. One such method we evaluated monitors unreacted amino groups with trinitrobenzene sulfonic acid (TNBS), which reacts with the amino groups of the protein that have not been succinylated (1–3).
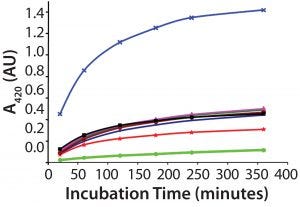
Figure 1: Several samples of recombinant protein were succinylated to increasing levels by varying the concentration of the succinylation reagent. After reaction with TNBS, each succinylated recombinant protein sample was measured for absorbance of remaining free amino groups. Note that the absorbance levels never plateau, even after almost six hours, preventing reliable use of this TNBS assay.
A direct spectrophotometric method uses absorbance of the TNBS chromophore to measure unsuccinylated amino groups on protein molecules. The reaction usually plateaus after 15–30 minutes, allowing calculation of a succinylation percentage. This assay should be amenable to validation. For this particular recombinant protein, however, the TNBS reaction unfortunately did not plateau even after 350 minutes regardless of the protein’s succinylation level (Figure 1). So we could use the TNBS method only as a qualitative assay. An alternative method would be required to quantitate the number of succinylation sites and degree of succinylation.
The Solution
Direct determination of the number of available succinylated amino groups would be a more reliable approach and provide more useful information. Size-exclusion chromatography (SEC) does not provide resolution of succinylated species, and tryptic peptide mapping with liquid chromatography–mass spectrometry (LC-MS) analysis of succinylated proteins is too complex to be useful as a monitoring assay.
Mass spectrometry (MS) has become an important emerging method for characterizing proteins traditionally used during early development. Until recently, MS experts had to interpret the complex data from MS analysis. However, recent developments in automated data acquisition and interpretation are facilitating greater use of MS methods for product characterization during late-stage clinical development, process validation, and potential quality-control (QC) release testing of biopharmaceutical products.
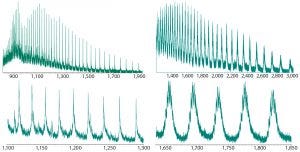
Figure 2: Intact ESI-MS spectra of both nonsuccinylated and succinylated proteins; upper figures represent the full charge envelope of the two proteins, and lower figures illustrate a narrower m/z charge range. Each m/z charge state of the nonsuccinylated protein was observed to be a primary species, whereas significant heterogeneity was seen for the charge states of the succinylated protein.
Thus we chose to explore intact mass analysis and evaluate whether intact MS held the potential to determine the degree of succinylation for this product. For this analysis, we used direct infusion of the nonsuccinylated and succinylated protein forms by electrospray hybrid-quadrupole time-of-flight mass spectrometry (ESI-MS). Figure 2 shows representative mass spectra. Each mass-to-charge ratio (m/z) state of a nonsuccinylated protein was identified as a primary species. The charge states of succinylated proteins showed significant heterogeneity. Our next challenge was to reproducibly deconvolute raw ESI mass spectra, whereby all multiply charged species are recalculated into singly charged forms and according to the m/z value and peak width.
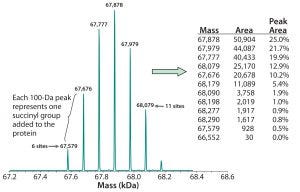
Figure 3: Deconvoluted MS charge-state data reveal the masses of individual succinylated protein species. Because each succinyl group adds 100 mass units to the recombinant protein (base MW ~67,000), the number of such groups present can be determined from the protein’s calculated mass. That allows for peak areas corresponding with each mass to be calculated, along with the percentage of the total for each species, as shown in the embedded table.
Figure 3 shows the resulting deconvoluted MS charge-state data derived using either Bayesian protein reconstruct or maximum entropy deconvolution algorithms. For the succinylated protein example in Figure 3, our reconstructed mass spectra produced seven distinct molecular species, each 100 Da apart. Each succinylated lysine residue causes a mass shift of 100.01 Da because of the additional succinyl group. Based on the known molecular weight of the nonsuccinylated protein, the species observed in Figure 3 represent addition of six to 11 succinyl groups.
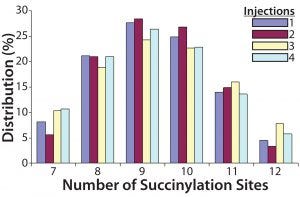
Figure 4: Four injections of one succinylated recombinant protein sample were made into an Applied Biosystems QSTAR mass spectrometer from Thermo Fisher Scientific. The resulting charge state data were deconvoluted to reveal the distribution of all succinylated species. Peaks accounting for <3% of the total peak area were discarded, and the area distribution of the remaining peaks was determined. In this case, the succinylated species ranged from seven to 12 sites each.
To transform the deconvoluted MS data into reportable results — and with the intention of using this ESI-MS infusion assay as a qualified method for monitoring the succinylation reaction — we limited quantitation of succinylated protein species to those >3% of the initial total peak area. Then we normalized the summed areas of the remaining peaks to 100% before calculating and reporting the area distribution among these peaks. Analysis of one succinylated recombinant protein sample in quadruplicate revealed that the mass determinations were highly reproducible, with most coefficients of variation (CV) <0.01% (Table 1). Area distributions of the succinylated species were also reproducible (Figure 4). These data gave us confidence that the method was yielding consistent results, which meant that the assay could be used to monitor the succinylation reaction during process validation.
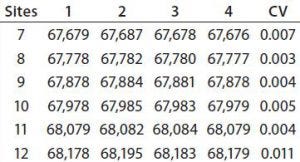
Table 1: Mass reproducibility of succinylated recombinant protein species
Process Validation
We validated the hapten–protein conjugation process according to PDA guidelines. A 2005 PDA guideline requires unit operations to establish critical parameters that correlate with product quality attributes (4). In addition, assays used to support process validation must be qualified, and release and in-process control assays must be validated. A predetermined number of production lots (typically three) that represent the licensed process are evaluated to demonstrate consistency. They are designated “conformance lots.”
Quality by design (QbD) requires that detailed knowledge of the critical quality attributes (CQAs) and the critical process parameters (CPPs) can be used to control overall product quality. A theoretical three-dimensional design space surrounds each manufacturing process that has been demonstrated to meet CQAs. The general biopharmaceutical industry and regulator view is that as long as a manufacturer keeps its process within that design space, then both process control and product quality should be safely ensured.
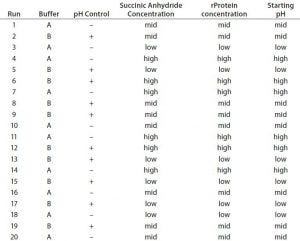
Table 2: Experimental design
Design-space considerations for our client’s succinylation reaction included six process parameters: succinic anhydride concentration, pH, temperature, protein concentration, buffer system, and mixing. We used range finding based on a design of experiments (DoE) approach to develop a design space and define acceptable operating ranges for those parameters. A 20-run fractional factorial DoE verified our range choices, and we evaluated the responses using both the TNBS and ESI-MS infusion assays.
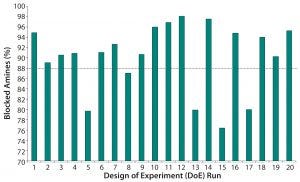
Figure 5: TNBS assay results for the 20 DoE runs show the percentages of blocked amines.
Table 2 lists the 20 experiments used in our DoE study along with their parameters. Qualitative TNBS data indicated a range of 75–98% blocked amines (Figure 5). ESI-MS infusion assay results for the DoE samples corresponded well with those results; samples with the highest percentage of blocked amines measured by TNBS exhibited >10 succinylation sites, as shown for three examples in Figure 6.
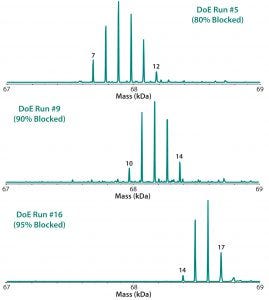
Figure 6: ESI-MS infusion assays results for three of the 20 DoE runs (Figure 5) show good agreement with the percentage of blocked amine results obtained from the TNBS assays.
Assay Qualification
Along with the client, we determined that the succinylation step should be considered a critical process attribute because it was an intermediate step in the manufacturing process. Thus, the ESI-MS infusion succinylation assay needed to be demonstrated as fit for purpose during process validation of the hapten–protein conjugation reaction. So the method needed to be “qualified” for its intended use (5).
The definition of assay qualification used at our company is establishing through documented evidence an analytical method’s performance characteristics such as repeatability, precision, and robustness. A qualified method is expected to yield consistent results that accurately reflect those quality characteristics of the product under analysis. We set several parameters for the qualification process in this case: e.g., specificity, repeatability, intermediate precision, range, robustness, and sample stability. Specificity was ensured by the absence of interference from buffers and the fact that the charge-state distribution for succinylated proteins is visually different from that for nonsuccinylated proteins.
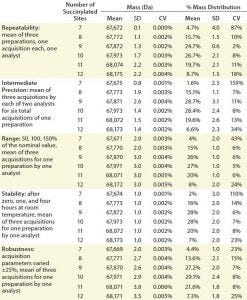
Table 3: Assay qualification; SD = standard deviation, CV = coefficient of variation
We set the acceptance criteria for parameters of the ESI-MS infusion assays for all species with an observed average mass distribution >10% as CV for the molecular weight ≤2% of each succinylated species and CV for the average mass distribution ≤20%. ESI-MS assays also must report the number of succinylation sites available (Table 3).
We tested repeatability using triplicate-succinylated preparations, each one analyzed a single time by a single analyst. Table 3 lists the results, which meet the set acceptance criteria. We demonstrated intermediate precision using two analysts working on two different days with single preparations analyzed in triplicate, and their results also met the acceptance criteria (Table 3).
We determined the assay range by analyzing sample concentrations at 50%, 100%, and 150% of the nominal value. After storing samples for zero, one, and four hours at room temperature, we evaluated their stability. Both assay range and stability results also met the acceptance criteria (Table 3).
To evaluate robustness, we varied the infusion rate, detector voltage, ion-spray (IS) voltage, declustering potential (DP), and focusing potential (FP) of a QSTAR mass spectrometer (Thermo Fisher/Applied Biosystems) ±25%. To do so, we used three acquisitions for one succinylated protein sample, each based on different acquisition parameters. The results also met our set acceptance criteria (Table 3).
To determine system suitability, we compared the number of succinylation sites and degree of succinylation mass profiles of reference materials. All qualification performance parameters were met, resulting in a successful assay qualification. Then we used the ESI-MS infusion succinylation assay to monitor the manufacturing process of our client’s hapten–protein conjugate.
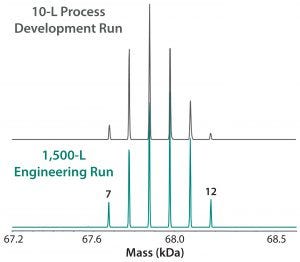
Figure 7: ESI-MS infusion assay results for a 10-L succinylation process batch and a 1,500-L engineering run illustrate very similar succinylation patterns. Numbers on the peaks indicate the number of succinylated sites in each peak.
Commercial-Scale Manufacturing
Our company’s manufacturing group performed an engineering run to demonstrate similarity between our 10-L small-scale development work and the intended 1,500-L commercial scale process. Figure 7 shows very good succinylation pattern agreement for batches of both sizes. We evaluated three current good manufacturing practice (CGMP) conformance lots to demonstrate consistency, and they also demonstrated very good reproducibility of succinylation patterns between lots (Figure 8).
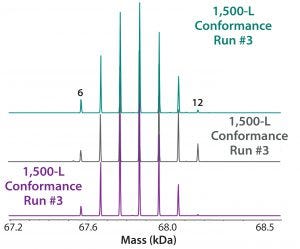
Figure 8: ESI-MS infusion assay results from three 1,500-L conformance lots for the succinylation process show very good reproducibility among them. Numbers on the peaks indicate the number of succinylated sites in each peak.
Better Characterized
In this case, a client came to FujiFilm Diosynth Biotechnologies with a hapten–protein conjugation project that turned out not to be amenable to the standard TNBS assay for determining the extent of succinylation. We developed an innovative MS-based assay to provide reliable results for directly determining the extent of the succinylation reaction, which was the first step in the coupling process. This assay provided additional information about the number of available succinylated sites that the TNBS assay could not measure, and we found this information to be very useful in monitoring and minimizing lot-to-lot variation.
References
1 Snyder SL, Sobocinski PZ. An Improved 2,4,-Trinitrobenzesulfonicacid Method for the Determination of Amines. Analyt. Biochem. 64, 1975: 284–288.
2 Sashidhar RB, et al. Quantitation of Epsilon-Amino Group Using Amino-Acids As Reference-Standards By Trinitrobenzene SulfonicAcid: A Simple Spectrophotometric Method for the Estimation of Hapten to Carrier Protein Ratio. J. Immunol. Meth. 167, 1994: 121–127.
3 TSTS28997: Instructions TNBSA. Thermo Fisher Scientific (Pierce Biotechnology): Rockford, IL, 2012; https://tools.thermofisher.com/content/sfs/manuals/MAN0011392_TNBSA_UG.pdf.
4 Technical Report No. 42: Process Validation of Protein Manufacturing. PDA J. Pharm. Sci. Technol. 59(4) 2005: S1–S28.
5 Ritter N, et al. What Is Test Method Qualification? Proceedings of the WCBP CMC Strategy Forum, 24 July 2003. BioProcess Int. 2(8) 2004: 32–42.
Miao-Fang Lin and Margo Wilson are senior scientists; Michael V. Murray, PhD, is director of downstream development; and Greg W. Adams, PhD, is director of analytical development at FUJIFILM Diosynth Biotechnologies, 101 J.Morris Commons Lane, Morrisville, NC 27560; 1-919-465-7505; [email protected].


