Figure 1: Regular size-exclusion chromatographic (SEC) analysis (pH 6–7) of monoclonal antibody (MAb) products purified by protein A affinity chromatography from batches 1–5
Therapeutic monoclonal antibodies (MAbs) mostly are manufactured using bioengineered mammalian cells cultured in a bioreactor for two to three weeks. High temperatures and an altered redox environment may compromise the quality of MAbs produced (e.g., fragmentation, truncation), as can the presence of proteases, reductases, and other chemicals released from dead cells. Thus, it would be valuable to establish analytical methods that can help cell culture groups monitor immunoglobulin G (IgG) product integrity in real time during a bioreactor run, especially during cell-line development and process scale-up.
In the early years of bioprocessing, product IgG titers usually were low, and animal serum often was included in culture media. That made direct analysis of IgG quality impractical. In the past 10–20 years, however, use of the animal-free culture media and higher titers of manufactured IgG products from Chinese hamster ovary (CHO) cells have made direct IgG analysis in harvest possible without significant matrix interference from host cell proteins or culture media (1, 2).
Direct analysis of harvest is a valuable tool for clone selection and bioreactor optimization without requiring IgG purification. This approach will save time from sample preparation. And it will provide a full spectrum of IgG fragmentation or aggregation information without a change in product profile (e.g., loss of fragmented IgG) caused by purification steps. Here, we present how we applied capillary sodium-dodecyl sulfate (cSDS) electrophoresis, surface-plasmon resonance (SPR), and size-exclusion high-performance liquid chromatography (SE-HPLC) to monitor the quality of IgG produced during clone selection and bioreactor optimization.
Materials and Methods
Bioreactor harvests were provided by our company’s upstream chemistry, manufacturing, and controls (CMC) group. For cSDS, we used an Agilent Bioanalyzer 2100 instrument with high-sensitivity protein-labeling reagents (catalog 5067-1577) and high-sensitivity protein chips (catalog 5067-1575), all from Agilent Technologies.
Bioreactor harvests were diluted 20-fold, stained with a fluorescent dye, and denatured with or without dithiothreitol (DTT) at 90 °C for five minutes. For measurement of antigen and antibody binding affinity, we again used antigen from Teva Biologics, this time on a Biacore 3000 instrument, with a CM5 sensor chip (catalog 29149604) and an amine coupling kit (catalog BR100050), all from Cytiva (formerly GE Healthcare).
Finally, for SE-HPLC we used an Agilent Advance Bio SEC (300Å, 4.6 × 150 mm, 2.7 μm) column on a Waters ultraperformance liquid chromatography (UPLC system). For regular SEC analysis, we used a 250 mM phosphate buffer with 150 mM NaCl as the mobile phase at a 0.3-mL/min flow rate. Samples were diluted to 1–2 mg/mL with SEC mobile phase. And our proposed low-pH SEC procedure was the same except that sample pH was adjusted to 3.6 using 0.1N HCl followed by dilution to 1–2 mg/mL using a glycine buffer (pH 3.6).
Results and Discussion
During our clone selection and bioreactor process optimization, our cSDS electrophoretic analysis showed that several of our MAb samples purified with protein A affinity chromatography showed a significant amount of fragmentation (data not shown). We further analyzed the same samples with regular SE-HPLC as above (samples at pH 6–7), surprised to find no product fragments in any sample (Figure 1). We reasoned that if product fragments elucidated by cSDS electrophoretic analysis are associated with IgG through a noncovalent interaction, then a mild sample treatment may not break that interaction in SEC.
Consequently, we treated the samples with an acid (pH 3.6) before another SE-HPLC analysis. The acid treatment mimics MAb purification steps such as IgG elution from a protein A column and subsequent viral inactivation. We observed low–molecular-weight (LMW) fragments from batches 1, 3, 4, and 5 in the resulting SEC chromatogram (Figure 2) that correspond to a half-mer IgG and correlate with what showed up with cSDS electrophoresis. A positive control MAb (batch 2) was found intact even after extended incubation for >24 hours at pH 3.6 (data not shown).

Figure 2: SEC analysis of MAb products purified by protein A affinity chromatography from batches 1–5 treated with acid (pH 3.6)

Figure 3: Representative nonreduced capillary sodium-dodecyl sulfate (cSDS) electrophoresis profile from MAb bioreactor harvests
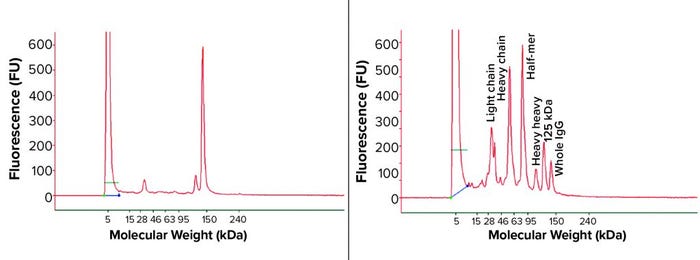
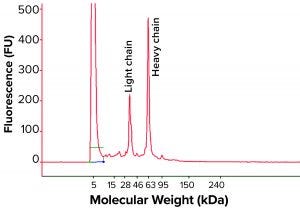
Bioreactor Harvest Analysis: It was unclear whether the IgG fragment issue discussed above was created during product purification process or had already occurred in the bioreactor. So we turned our attention to the bioreactor harvest to address this fragmentation issue. We analyzed bioreactor harvest samples by nonreduced cSDS electrophoresis and found different fragments corresponding to the half-IgG molecule, a single heavy chain, and a light chain based on molecular weights (Figure 3). A positive control bioreactor harvest under the same experimental condition showed a normal profile, with 95% intact IgG peak and a low percentage of a single light-chain and a 125-kDa peak characterized as the IgG product with one light chain missing. The culture medium itself gave no signal when measured (data not shown), suggesting a lack of interference from the serum-free culture medium to the cSDS electrophoretic assay.

Figure 4: Nonreduced cSDS electrophoresis profile from a MAb bioreactor harvest at days 11, 12, and 13
The IgG fragments correlated well with cell viability, and we found significant fragmentation toward the late stage (final days) of bioreactor run (Figure 4). When all bioreactor harvest samples were analyzed using reduced condition, only heavy-chain and light-chain peaks appeared in cSDS electrophoresis, which suggests that the fragmented peaks were part of the IgG and probably not derived from host-cell proteins (Figure 5). The elevated baseline may have come from host-cell proteins, however.

Figure 5: Representative reduced cSDS electrophoresis profile from a MAb bioreactor harvest
We further analyzed the bioreactor harvest using low-pH SE-HPLC as discussed above to determine whether similar interpretation with regard to the fragmentation phenomenon could be made without the SDS and heat treatment required for cSDS electrophoretic analysis. Figure 6 shows that the low-pH (3.6) SEC analysis of bioreactor harvest samples from batches 1–5 clearly indicates the half-mer fragmentation observed from batches 1, 3, 4, and 5 bioreactor samples, whereas the positive control from batch 2 was found intact.
We discovered that a pink color in the purified drug substance was associated with the degree of IgG fragmentation: The more fragments were present, the darker the pink color in the purified intermediates and drug substance. Several publications have confirmed the source of that color coming from Vitamin B12 (3). Increased free thiols from fragmented IgG (as measured by Ellman’s assay) (4) could be the root cause of the pink color in our case.
CHO cells should secrete only well-assembled whole IgG into their culture medium (5). IgG fragments would be either released from dead cells or reduced by chemicals released from such cells. We did observe a correlation between IgG fragments and low cell viability (data not shown). Several publications suggest that intracellular reducing enzymes and substrates/cofactors released from lysed cells could break the disulfide bonds in IgG molecules as the major root cause of IgG fragmentation (1). Based on our analysis of harvests collected from different time points, that reduction happened quickly and in a short time (Figure 4).

Figure 6: Low-pH (3.6) SEC profile for the MAb bioreactor harvest
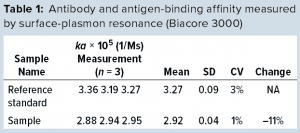
We also explored SPR technology for monitoring IgG quality in bioreactor harvest. By comparison with a reference standard, we found that our fragmented IgG sample showed an 11% reduction in antigen binding affinity (Table 1). Although the results were not as profound as those from cSDS electrophoresis and low-pH SEC, the SPR technology did provide us with another direct quality control over product IgG functionality from bioreactor harvest samples without a need for sample purification.
 Quality Begins in the Bioreactor
In summary, we used simple and modified analytical tools to examine bioreactor harvests, and the results provided a useful guide in clone selection and bioreactor process development. Bioreactor runs constitute a most lengthy step in the manufacture of the therapeutic MAb products, with a number of potential risk factors that can influence product quality (e.g., high concentrations of proteases and reducing chemicals at late stages of a bioreactor run). Analytical assays are not often applied to direct IgG analysis of bioreactor harvest materials because of concerns with matrix interference from culture medium and host cell proteins. Technological advances in both bioreactor controls and analytical methods have made it feasible to perform direct analysis of bioreactor harvest, as we have confirmed, as a characterization and monitoring tool to help make MAb drug substances both purer and safer than ever before.
Acknowledgments
Special thanks go to Meimei Liu and Shyamsundar Subramanian for providing bioreactor harvest materials; to Lillian Kim (an intern from University of Pittsburgh) for proofreading; and to Ping Feng, Mi Jin, and Jason Bock for management support.
References
1 Hutterer K, et al. Monoclonal Antibody Disulfide Reduction During Manufacture. mAbs 5(4) 2013: 608–613; https://doi.org/10.4161/mabs.24725.
2 Paul A, et al. Direct Analysis of MAb Aggregates in Mammalian Cell Culture Supernatant. BMC Biotechnol. 14, 2014: 99; https:doi.org/10.1186/s12896-014-0099-3.
3 Derfus G, et al. Red Colored IgG4 Caused By Vitamin B12 from Cell Culture Media Combined with Disulfide Reduction at Harvest. mAbs 6(3) 2014: 679–688; https://doi.org/10.4161/mabs.28257.
4 Ellman GL. Tissue Sulfhydryl Groups. Arch. Biochem. Biophys. 82(1) 1959: 70–77; https://doi.org/10.1016/0003-9861(59)90090-6.
5 Haryadi R, et al. Optimization of Heavy Chain and Light Chain Signal Peptides for High Level Expression of Therapeutic Antibodies in CHO Cells. PLoS One 10(2) 2015: e0116878; https://doi.org/10.1371/journal.pone.0116878.
This article is adapted from a February 2018 eBook by BioProcess International. Author information is provided as it was in the original.
Guanglou Cheng, Abhijit Shirke, and Linas Antoniukas are scientists; Dharmesh Kanani is a senior scientist; John Kim is associate director; and corresponding author Bing Hu is principal scientist in chemistry, manufacturing, and controls at Teva Biologics in West Chester, PA; 1-610-883-5588; [email protected].


