Virus-Filtration Process Development Optimization: The Key to a More Efficient and Cost-Effective Step
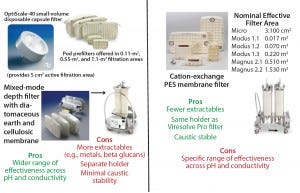
Figure 4: Description of Viresolve Prefilter (left) and Viresolve Pro Shield (right) adsorptive prefilters
Size-exclusion–based parvovirus filtration is an important step toward drug product safety in biopharmaceutical production. However, once a virus filter is in place, and the required virus safety is ensured, less attention typically is paid to its optimization within the process. That might seem odd given that virus filtration can be one of the more expensive downstream processing steps ($/g protein processed). Most likely, the lack of attention can be attributed to aggressive timelines, limited process development resources, and the virus filter’s inability to separate drug-product intermediates from host-cell protein and DNA impurities. Most biopharmaceutical process development resources are dedicated to the primary goal of achieving the required drug-product purity. For sound reasons, most of the process-optimization effort goes into critical chromatographic purification unit operations. However, some virus-filter vendors offer significant guidance and extensive hands-on help, which can help biopharmaceutical manufacturers achieve both the highest level of virus safety and virus-filtration cost optimization.
The difficulty of virus-filter separations is underappreciated. Such operations require 100% passage of a ~10-nm monomeric drug-product intermediate (1, 2) and ≥4 log removal of ~20-nm viruses. Furthermore, as drug-product intermediate concentrations increase at the virus-filtration step, and other constraints such as processing-time targets decrease, more process development attention can help optimize this step by making it more efficient and lowering overall cost.
As drug-product concentrations go up, aggregate levels in the intermediate feeds tend to increase as well. That affects virus filters in two ways: First, even without increased aggregates, more monomeric proteins trying to cross the membrane at the same time lowers its starting flux (a polarization effect); second, increased aggregates (dimers, trimers, and so on) can plug filter pores and reduce volumetric throughput (a fouling effect). MilliporeSigma recommends use of in-line adsorptive prefilters to remove foulants (presumably aggregates) and prevent fouling of virus filters (3, 4). An adsorptive-prefilter strategy allows for both optimal flux and volumetric throughput (L/m2). Here we describe optimization efforts using a Viresolve Pro filter coupled in-line with an adsorptive prefilter for a monoclonal antibody (MAb) at 9–13 g/L.
Optimization Parameters (5): Optimization of parvovirus filtration can include changes to pH and/or conductivity from values existing at the preceding chromatographic step, which can reduce aggregate levels in a process stream. Optimization also can include in-line adsorptive prefilters that remove aggregates present in the feed coming directly from the upstream unit operation. In some cases with adsorptive prefilters in place, pH and/or conductivity changes also can be used to optimize the foulant-binding affinity of that prefilter, thereby optimizing virus-filter throughput (3).
Another potential optimization parameter is placement of the virus filter within the process train (following either the second or third column). For particular drug-product intermediates, one placement sometimes works better than another. Virus-filter optimization also can be achieved with higher feed pressures or flows with a higher starting flux (L/m2/h). The fouling profile will be the same — describing a reduction of permeability in L/m2/h/psi with throughput (L/m2) — but more feed can be processed in a fixed period, making the process more productive and time efficient (5).
The strategy we use here strictly focuses on optimization after the third column and running at 30-psi feed pressure. Viresolve Pro filters can run with ≤50-psi feed pressure, but some manufacturing plants limit line pressures to lower levels for safety.
Materials and Methods
The MAb feeds we used were three different third-column pools between 9 and 13 g/L at pH 5.0 and 15 mS/cm conductivity. The first feed (Feed 1) came from multiple elution pools at 9.7 g/L that were generated using smallscale third columns processing a secondcolumn feed from a pilot-scale run. Feeds 2 and 3 were elution pools that came directly from two different thirdcolumn pilot runs (both at 12.4 g/L). All feeds were unfrozen and zero to five days old, stored cold until use, then warmed up to room temperature just before virus filtration. We pH-adjusted some feeds at small scale by placing a pH probe in the feed on a stir plate, making small additions of a buffer concentrate and gently mixing the feed using a magnetic stir bar until its pH reached a target value (5.5–7.0). With pH adjustment, conductivities remained about the same. Before the virus-filter runs, these feeds were 0.2-µm vacuum filtered. The pilot-scale run used similar mixing and buffer addition methods for pH adjustment (in a tank with a top-fed mixer and pump for buffer addition) suited for the larger ~60-L scale.
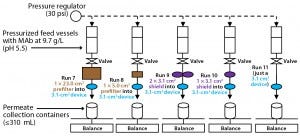
Figure 1: Laboratory-scale experimental setup
Laboratory Scale: Each Viresolve Prefilter (catalog #SSPVA40NB9) with 5 cm2 of filtration area was wetted and flushed at ~20-psi constant feed pressure for about 10 minutes. After starting slow, the flow increases with processed volume, reaching a final wetted flow rate of ~6 mL/min for each 5-cm2 filter. For the wetting and flushing, we used ~45 mL of water per 5-cm2 prefilter. After that initial water wet and flush, we flushed buffer through the filter(s) at 20-psi constant feed pressure for four minutes with a flow rate of ~6 mL/min for each prefilter, using about 24 mL per 5-cm2 filter. Following buffer equilibration, we assembled the prefilter(s) upstream in-line of a previously prepared Viresolve Pro filter. We used the same procedure for the larger 23-cm2 prefilter (#MA1HC23CL3) after venting it of all air with proportionally larger flows and volumes of water and buffer for the larger-area prefilters.
With 3.1 cm2 of filtration area, each Viresolve Pro Shield (#VPMSKITNB9) was vented of all air and then wetted and flushed at ~20-psi constant feed pressure for about five minutes. The flow rate was ~15 mL/min. For wetting and flushing, we used ~75 mL of water per 3.1 cm2, preparing either one or two in parallel. After the initial water wet and flush, we flushed buffer through the shield(s) at 20-psi constant feed pressure for two minutes. The buffer flow rate was ~30 mL/min for each shield. Buffer flushing used ~60 mL per 3.1-cm2 shield. Following buffer equilibration, we assembled the shield(s) upstream in-line of a previously prepared Viresolve Pro filter.
With 3.1 cm2 of filtration area, each Viresolve Pro filter (#VPMCPDKNB9) was vented of air and then wetted and flushed at ~50-psi constant feed pressure for about 10 minutes with a flow rate of ~3.5–3.8 mL/min. For wetting and flushing, we used ~37 mL of water. After that, we passed buffer through at 50 psi for four minutes (15 mL total). After that equilibration, we assembled the Viresolve Pro filter in-line downstream of the adsorptive prefilter(s) and ran it with buffer at 30 psi for three minutes before load processing. Then a MAb load was processed at 30-psi constant feed pressure, with cumulative filtrate weight tracked over time. We processed 31–310 mL for each laboratory-scale run.
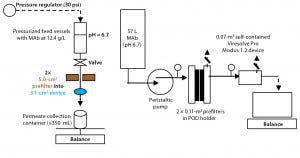
Figure 2: Side-by-side laboratory and pilot-scale experimental setups
Pilot Scale: The pilot-scale run used two 0.11-m2 Viresolve Prefilters in parallel (#MSPV01FS1), both vented of all air. We flushed them with water using a peristaltic pump at ~2.2 L/min or 600 LMH for about 11 minutes (with 24 L or 109 L/m2 total flushed). Feed pressure started at 11 psi and dropped at constant flow to ~6 psi as the filters wetted out. Using the same pump setting, buffer at pH 6.68 and 15.39 mS/cm conductivity was flushed for ~4.5 minutes (12 L total or 55 L/m2 at ~2.6 L/min and ~5 psi). Then we assembled the prefilters upstream in-line of a previously prepared Viresolve Pro filter.
The pilot-scale run used a single 0.07m2 Viresolve Pro Modus 1.2 device (#VPMD102NB1) vented of all air. We wetted and flushed it with water at a pump speed generating ~30 psi at the filter inlet for about five minutes. Exiting filtrate was collected in 4-L graduated cylinders for tracking cumulative filtrate volume over time. At a flow rate of ~0.9 L/min, we flushed the filter with ~5 L of water. Following the initial water wet and flush, we passed ~2.2 L of buffer through for 2.5 minutes at the same 30-psi feed pressure and 0.9 L/min flow rate. Then we connected this device downstream of the two previously prepared 0.11-m2 Viresolve Prefilters.
We set the feed pump speed to generate ~30 psi at the virus filter inlet. With a steady flow achieved through these filters and ~2.2 L of buffer passed through, we could process the MAb load (12.4 g/L) at 30-psi feed pressure. Again, cumulative filtrate weight was tracked over time: ~57 L processed in 2.6 hours (0.5-L/min starting load flow, 0.33-L/min ending load flow). After load processing, we buffer-flushed all feed from the filters to achieve ~100% drug-product yield (10 L of buffer total, flow starting at 0.33 L/min and ending at 0.43 L/min). Following that buffer flush, we flushed the virus filter with water and ran a postuse integrity test using an automatic integrity tester. It passed the test, with a measured diffusion at 50 psi of 1.86 cc/min < 2.7 cc/min.
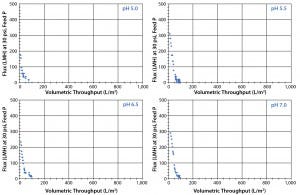
Figure 3: Four graphs show laboratory-scale Viresolve Pro device by itself (with no adsorptive prefilter) across a pH range (5.0 with Feed 1; 5.5, 6.5, and 7.0 with Feed 2)
Results and Discussion
Virus Filter Alone: Our approach included both the use of an adsorptive prefilter and a pH change to significantly increase the efficiency and reduce the cost of a virus-filtration step. Throughput with no adsorptive prefilter at the unadjusted pH of 5.0 was only 100 L/m2 (Figure 3), which remained the same across a range of pH adjustments (5.0–7.0). So for this particular MAb, the aggregate levels did not lower significantly with pH adjustment. In fact, testing showed that the aggregate levels increased slightly with higher pH levels (data not shown). That slight increase did not further reduce the capacity of the filter alone, however. We found no difference between the feed lots tested (Feed 1 and Feed 2). By contrast, adding an adsorptive prefilter and a pH change to 6.7 increased the achievable throughput to >900 L/m2 (Figures 7–9).
Adsorptive Prefilter Options: To be rigorous, we tried two types of adsorptive prefilters in this optimization project: a sterilizing-grade membrane with cation-exchange chemistry and a diatomaceous-earth–containing depth filter. Both prefilters remove foulants by adsorption, the former by ion exchange and the latter by mixed-mode and hydrophobic binding. Either filter can be used effectively to protect a virus filter and reduce costs (3, 4). The Viresolve Pro Shield filter has the benefit of the same module design as the Viresolve Pro device (can be used on the same holder), and as a membrane-based filter it has a relatively low extractables level. It works effectively over a specific range of pH and conductivity compared with the Viresolve Prefilter device. The Viresolve Prefilter requires a separate holder and presents a relatively higher extractables level (Figure 4) (6, 7).
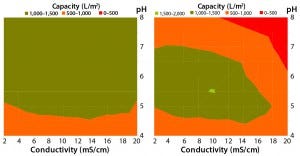
Figure 5: Viresolve Prefilter (left) and Viresolve Pro Shield (right) performance maps demonstrate their ability to protect a Viresolve Pro filter as a function of feed pH and conductivity, with heatshocked immunoglobulin G (IgG) used as a mock feed stream.
Pros and Cons: MilliporeSigma R&D has conducted experiments with a surrogate feed stream containing high aggregate levels, which provides some guidance regarding optimal pH and conductivity ranges for both the Viresolve Prefilter device and the Viresolve Pro Shield filter to protect a Viresolve Pro filter. At pH levels of 5.0–7.0, the Viresolve Pro Shield’s ability to remove aggregates and protect a virus filter drops off at conductivities in the range of 14–18 mS/cm for the mock feed stream shown (Figure 5).
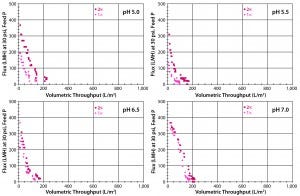
Figure 6: Four graphs show Viresolve Pro Shield and Viresolve Pro filters with 1:1 and 2:1 area ratio as a function of pH (5.0 with Feed 1; 5.5, 6.5, and 7.0 with Feed 2).
Viresolve Pro Shield with Viresolve Pro Virus Filter: Because the MAb feed was at pH 5.0 and ~15 mS/cm, we tried the Viresolve Pro Shield filter both at the standard 1:1 (3.1 cm2) and a doubled binding-site 2:1 (6.2 to 3.1 cm2) adsorptive prefilter to virus filter area ratio, both over a pH range (5.0–7.0). Performance increased insignificantly to 100–200 L/m2 for all pH levels and both area ratios (Figure 6). That lack of effectiveness was probably attributable to the higher conductivity, which can interfere with an ion-exchange mechanism of aggregate removal. We saw no difference between Feeds 1 and 2. A reduction in feed conductivity would require dilution. We did not pursue that approach because of virus-filter feed-tank volume limitations and the higher volumes that would need to be processed for a downstream ultrafiltration/diafiltration (UF/DF) step.
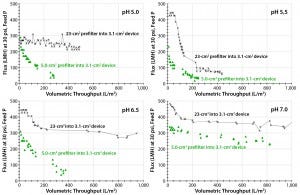
Figure 7: Four graphs show Viresolve Prefilter and Viresolve Pro filters with area ratios of 1.6:1.0 cm2 and 7.4:1.0 cm2 as a function of pH (5.0 with Feed 1; 5.5, 6.5, and 7.0 with Feed 2).
Viresolve Prefilter with Viresolve Pro Virus Filter: The change from the virus filter alone to including a 7.4-cm2 to 1.0-cm2 area ratio, in-line prefilter at pH 5.0–5.5 increased the throughput from 100 L/m2 to >400 L/m2, significantly reducing process cost (Figure 7). However, that area ratio is impractical because it requires an unmanageable number of prefilters (exceeding the maximum capacity of the manufacturing plant’s prefiltration holder).
We further optimized this process by changing pH from 5.5 to 6.5 and 7.0. As pH increased, the affinity of the aggregates for the prefilter binding sites increased to the point at which an area ratio of 1.6 cm2 (prefilter) to 1.0 cm2 (virus filter) was all that was needed to achieve 900 L/m2 (Figure 7, bottom-right panel) (3). Note that both area ratios showed the same flat fouling profile at pH 7.0, which means that the affinity of the foulant for the prefilter media is higher at pH 7.0 than at pH 5.5, so the extra prefilter area would not be needed.
Note that we used different feed lots. The first feed (Feed 1) at lower concentration (9.7 g/L) was tested only at pH 5.0. We tested the second feed lot (Feed 2) over a broader range of pH levels (5.5–7.0). Feed 2 was more difficult to filter than Feed 1 probably because of its higher concentration (12.4 g/L) and/or age (≤5 days). We believed that to be the cause of the difference in the 7.4:1.0 area ratio runs shown in the two upper panels of Figure 7.
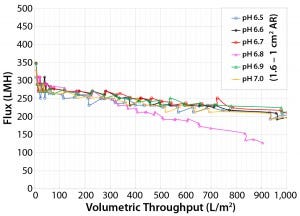
Figure 8: Area ratio of 1.6 Viresolve Prefilter to 1.0 (Viresolve Pro) filters as a function of pH (6.5 to 7.0 in increments of 0.1 pH) with Feed 3
Fine-Tuning with pH Optimization: Manufacturing-plant constraints were such that the volume of the virus filter load at pH 5 and added volume for pH adjustment up to 7.0 would exceed existing tank volumes. Combined with a desire to keep the pH further away from the MAb pI (isoelectric point), that situation led to more optimization experiments across pH 6.5–7.0 (Figure 8). We saw no distinct difference across that range, so we targeted pH 6.8 for the first Viresolve Prefilter–Viresolve Pro pilot run. We attributed the difference in performance between Feeds 2 and 3 at pH 6.5 using a 1.6:1.0 area ratio (lower left graphs, Figure 7 and Figure 8) to the freshness of Feed 3 (hours old rather than days). Feed 2 at pH 6.5 achieved 400-L/m2 with 90% flow decay, whereas Feed 3 at pH 6.5 achieved 1,000 L/m2 with 33% flow decay.
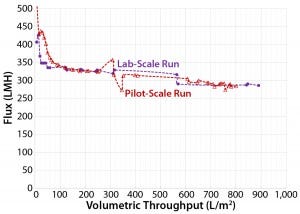
Figure 9: Area ratio of 3.2 (Viresolve Prefilter) to 1.0 (Viresolve Pro) filters with pH = 6.7 for side-by-side laboratory-scale and pilot-scale run using Feed 3
Robustness and Pilot-Run Scale-Up: One additional consideration was the process robustness and safety factor. We used an area ratio of 3.2:1.0 instead of 1.6:1.0, assuming that would cover potential challenges from even more difficult feeds (concentrations >12.4 g/L, age effects with process delays, and so on). We executed a pilot run processing ~57 L of feed adjusted to pH 6.7 and a 3.2:1.0 ratio. An additional side-by-side laboratory-scale run used the same feed material (Figure 9). Both runs together showed very good scalability and easily achieved >800–900 L/m2.

Table 1: Improvement in parvovirus-filter throughput and process efficiency at different stages in process development; VF = virus filter
Worth the Effort
Our data illustrate the significant benefits that can be reaped through increased time and effort put into optimization of a parvovirus-filtration process (Table 1). The beginning throughput achieved with a virus filter alone at initial processing conditions of pH 5.0 was only 100 L/m2. After our optimization efforts, the process achieved a throughput of 1,000 L/m2. That was accomplished through use of an adsorptive prefilter with a robust area ratio relative to the virus filter and a pH adjustment that maximized the foulant affinity of the adsorptive prefilter. Optimization efforts like those discussed herein can help biopharmaceutical manufacturers run their rigorously developed, robust parvovirus filtration process as cost-effectively as possible, while still maintaining the highest level of virus safety.
References
1 Reth M. Matching Cellular Dimensions with Molecular Sizes. Nat. Immunol. 14(8) 2013: 765–767; doi: 10.1038/ni.2621.
2 Harris LJ, et al. Refined Structure of an Intact IgG2a Monoclonal Antibody. Biochem. 36(7) 1997: 1581–1597.
3 Bolton GR, Spector S, Lacasse D. Increasing the Capacity of Parvovirus-Retentive Membranes: Performance of the Viresolve Prefilter. Biotechnol. Appl. Biochem. 43(1) 2006: 55–63.
4 Brown A, et al. Increasing Parvovirus Filter Throughput of Monoclonal Antibodies Using Ion Exchange Membrane Adsorptive Pre-Filtration. Biotechnol. Bioeng. 106(4) 2010: 627–637.
5 Lit No. RF1013EN00 Rev. B, 11/14 DP SBU-12-07371: Viresolve® Pro Solution Performance Guide. EMD Millipore Corporation: Billerica, MA, 2014.
6 Technical Brief TB4111ENO, Revision A. Viresolve® Prefilter — Extractables Characterization. EMD Millipore: Billerica, MA, August 2012.
7 Gefroh E, et al. Multipronged Approach to Managing Beta-Glucan Contaminants in the Downstream Process: Control of Raw Materials and Filtration with Charge-Modified Nylon 6,6 Membrane Filters. Biotechnol. Prog. 29(3) 2013: 672–680.
8 Siwak M, et al. Process for Removing Protein Aggregates and Virus from a Protein Solution. US PTO #7,118,675. EMD Millipore: Billerica, MA, 10 October 2006.
9 Siwak M, et al. Process for Removing Protein Aggregates and Virus from a Protein Solution. US PTO # 7,465,397. EMD Millipore: Billerica, MA, 16 December 2008.
Jaime De Souza and Ken Scott are biomanufacturing engineers, and corresponding author Paul Genest is a consulting engineer in MilliporeSigma’s BioManufacturing Sciences Network (BSN), 900 Middlesex Turnpike, Billerica, MA 01824; [email protected]. Viresolve is a registered trademark of MilliporeSigma, a division of Merck KGaA.
You May Also Like
