Continued Process Verification: A Multivariate, Data-Driven Modeling Application for Monitoring Raw Materials Used in Biopharmaceutical Manufacturing
Biologics manufacturing entails multiple complex unit operations across three key process areas: cell culture, purification, and sterile fill–finish (Figure 1). Numerous raw materials are used to formulate reagents that are vital to those processes. For example, bioreactors require cell-culture media, and buffer solutions are used during both drug-substance filtration and drug-product final formulation. Changes in raw-material properties can introduce variation in the performance of intermediate processes and in product quality attributes. Therefore, raw-material properties must be monitored to help ensure consistently high product quality.
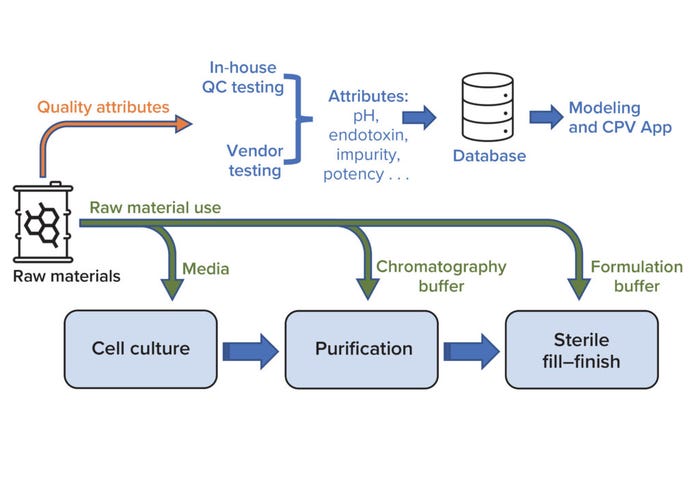
Figure 1: Overview of raw-material use in key biomanufacturing processes (cell culture, purification, and sterile fill–finish) and a high-level workflow for raw-material data use during quality monitoring; CPV = continuous process verification, QC = quality control.
Continued process verification (CPV) is a formal framework for ensuring that a biomanufacturing process (and the subsequent biologic product) remains within its validated state (1). CPV also enables process improvements and satisfies regulatory requirements for life-cycle validation. A CPV program entails routine analysis of data pertaining to critical process parameters (CPPs) and critical quality attributes (CQAs) across an entire manufacturing process. Thus, CPV is an appropriate methodology for monitoring the consistency of raw-material properties and, consequently, process performance.
Traditionally, implementation of CPV has involved individual, independent evaluation of CPPs and CQAs throughout a manufacturing process. Attributes often are assessed against predetermined, attribute-specific control limits. Although doing so is effective in identifying single attributes that may be out of control, generating and assessing multiple univariate plots (one for each attribute) can be a labor-intensive and error-prone endeavor owing to the complexity of biomanufacturing processes. Furthermore, univariate CPV can miss subtle, multiattribute trends.
Multivariate data analysis (MVDA) provides an alternative approach to implement CPV that can reduce the burden of monitoring multiple CPPs and CQAs. MVDA comprises advanced statistical algorithms that can be leveraged to analyze large, complex, and heterogeneous data sets and to detect changes and excursions. MVDA models can monitor multiple process variables and quality attributes using only a few multivariate metrics while leveraging useful information found in the correlation structure among multiple process parameters and attributes. MVDA methods have been used to support process understanding, monitoring, and troubleshooting (2–5). Regulatory agencies also consider MVDA models to be effective ways to monitor process and product quality (1, 6–8).
Herein, we showcase our implementation of a multivariate CPV approach to monitoring raw materials used in biologics manufacturing. Specifically, we describe our development of an MVDA-based software application along with examples of its utility for detecting excursions in raw-material properties. Finally, we discuss what we have learned from this work.
Materials and Methods
Data Source and Pipeline: As part of our established CPV program, raw materials are subjected to multiple assays at our quality control (QC) analytical laboratories to assess various quality attributes. Such data are collected and stored in a relational database (RDS) for subsequent analysis.
The database system comprises subsystems for source-data collection, data integration, and cloud-based storage (Figure 2). Quality-attribute data are captured from our analytical laboratories through two systems of record: SAP software and a laboratory information-management system (LIMS). After capture, data from both sources are integrated using Biovia Discoverant software (Dassault Systèmes) and stored in a database (9).
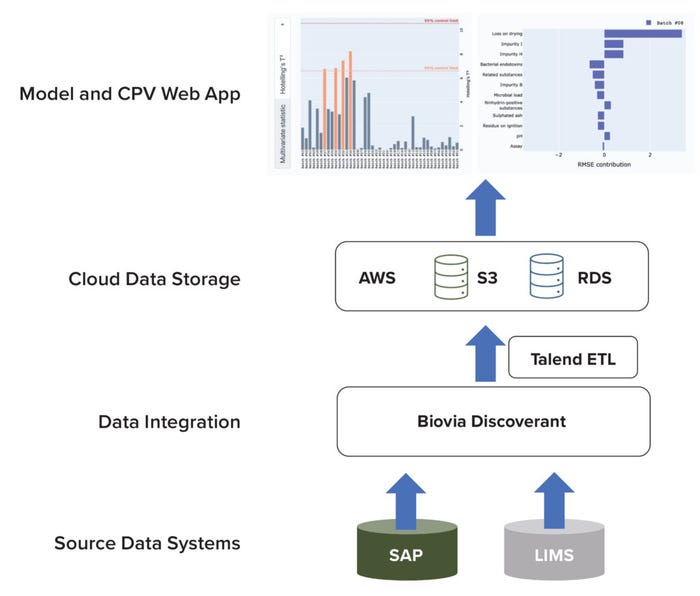
Figure 2: Architecture of a data pipeline for raw-material quality attributes in a cloudbased environment; AWS = Amazon Web Services; CPV = continued process verification; ETL = extract–transform–load; LIMS = laboratory information-management system; RDS = relational database; SAP = systems, applications, and products software; S3 = Simple Storage Service solution.
To facilitate model development and application execution, snapshots of data are uploaded routinely by a Talend extract–transform–load (ETL) pipeline. The ETL pipeline extracts data from the Discoverant platform, transforms them into an appropriate data structure (e.g., a spreadsheet), and loads the resulting data into a cloud storage system. We use the Simple Storage Service (S3) solution from Amazon Web Services (AWS) for cloud storage of transformed data. AWS provides multiple cloud-computing services that can be exploited to implement an application (10). We also use an AWS-based RDS for model-inference outputs. Our CPV web application accesses both the S3 and RDS platforms to display outputs to end users.
Data Preprocessing: Quality attributes can be quantitative (e.g., potency, pH, and bacterial-endotoxin levels) or qualitative (e.g., whether a sample passes contamination tests). The presented model and application use quantitative data only. In the case of glycine powder, a raw material that we will use as an example in a subsequent section,
12 variables are relevant (see the “Glycine Powder” box).
Glycine Powder: Variables for Analysis • bacterial endotoxins • critical impurities (B, H, and I) • loss on drying • microbial load • ninhydrin-positive substances • pH • related substances • residue on ignition • sulfated ash. |
Selected analytical data are processed to achieve a complete and consistently scaled data set. First, missing values are imputed with a representative value (the median of the available values). Next, z-score normalization is carried out for each variable by centering (subtracting the mean) and scaling for unit variance (dividing by the standard deviation).
Modeling Approach — Principal Component Analysis (PCA): The preprocessed training data set is used to develop a PCA model. PCA is explained extensively in our previous publication (11). In brief, PCA is an unsupervised machine-learning (ML) method used to reduce the dimensionality of data sets in which correlations between variables are present. PCA summarizes original data by transforming them into new, uncorrelated latent variables. Also known as principal components (PCs), those variables are linear combinations of the original variables. PCs are chosen such that the variance explained by a fixed number of PCs is maximized.
To facilitate quality monitoring and outlier detection, two excursion-detection metrics can be derived from a PCA model, defined here as Hotelling’s t2 statistic and the squared prediction error (SPE). Hotelling’s t2 statistic is a multivariate generalization of the Student’s t-test statistic that provides a check for observations against multivariate normality (12). Therefore, the t2 statistic can be used to define a 95% or 99% confidence region for screening abnormal observations. The Hotelling’s t2 statistic for each observation quantifies the distance of that observation from the projected PCA model center within the PCA model hyperplane. Consequently, the statistic can be used to identify extreme values in observations with a correlation structure that fits the PCA model.
By contrast, SPE is calculated from the squared residual for each observation with respect to the PCA model. This statistic provides a means to measure the perpendicular distance of each observation to the PCA model hyperplane and summarizes an observation’s fitness with the PCA model (13, 14). A control limit (e.g., 95%) can be generated and applied to screen for excursions. SPE is used to identify observations that a PCA model cannot describe well, problems that could indicate novel behavior and process drift.
Dashboard: The application front end is an interactive dashboard that enables users to explore both univariate and multivariate trends across modeled raw materials. The dashboard is implemented using Dash for Python, a framework that unifies the graphing library Plotly and other dashboard components with Flask, a general web-application framework (15–17). Additional application layout and styling utilities are provided by Dash Bootstrap Components (18). The prototype application is deployed and hosted using Domino Data Lab (19), a cloud-based platform for data-science applications.
Results
Using cloud technology, we have established an MVDA-based software application that can evaluate data for potential changes in raw-material properties upon receiving change notification from the material’s manufacturer (e.g., a change in process or manufacturing site), support the efficient implementation of CPV, and assist with evaluating the potential contribution of raw-material variation during manufacturing investigations.
Raw-material properties measured in our QC laboratory are mapped and loaded into an AWS-based data-storage service. For each raw material, those data are used to develop a PCA model, which in turn can help in identifying outlier batches and interrogating root causes through a Domino-hosted dashboard. (Refer to the Materials and Methods section for background about applied techniques and technologies.)
Below, we present glycine powder as one raw material that our CPV application can process, and we demonstrate how the application can facilitate quality-monitoring tasks. Glycine powder is used frequently in biopharmaceutical manufacturing — e.g., as a component in formulation buffers that are used for drug-substance filtration. Our PCA model for glycine powder was trained on data from
43 available batches. Two PCs accounting for 50.3% of the variance were selected using a cross-validation procedure (20).
Input-variable values and PCA-model outputs are provided to users by an interactive dashboard, as shown in Figure 3. A user can select a material of interest and date range for display, and the interface will update the corresponding plots (Figure 3a). After making those selections, users can choose to display either multivariate statistic (Hotelling’s t2 statistic or the SPE, Figure 3b) beside a variable of choice (Figure 3c). In either plot, statistical limits can highlight out-of-trend batches. Clicking on a batch will display its contribution to the selected statistic from each variable in the bottom-left panel (Figure 3d). Variables can be sorted in this panel by name or value, and clicking on a variable will change the one displayed in the main panel. A downloadable table will update to show users the original variable values for selected batches (Figure 3e). Users can access background information from subject-matter experts (SMEs) by selecting a tooltip beside the material-selection dropdown box.
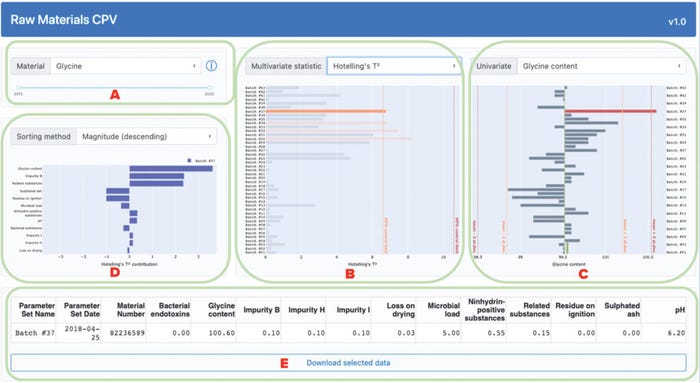
Figure 3: Overview of an application dashboard for multivariate data analysis (MVDA)–based continued process verification (CPV) of raw materials used in biomanufacturing processes; the dashboard includes menus for selection of (a) material type and process date range,
(b) statistical method, (c) variable of interest, and (d) sorting method for analysis of a variable’s magnitude. The application also generates (e) downloadable tables with values from selected batches.
With this interface, users can identify and interrogate potential outlier batches interactively. For example, Figure 4 shows that batches #30, #32, #34, and #37 exceed the 95% control limit for the Hotelling’s t2 statistic. Therefore, those batches might contain extreme values in some correlated variables. The contribution plot for batch #37 indicates that the strongest contributor to the excursion in the Hotelling’s t2 statistic is the percentage of glycine content. To confirm that finding, we can explore the univariate chart of the original reading of the specific variable, labeled “glycine content.” As Figure 4c shows, the glycine-content reading of batch #37 is significantly higher than that of the other batches, exceeding the mean (~99.5%) by more than three standard deviations.
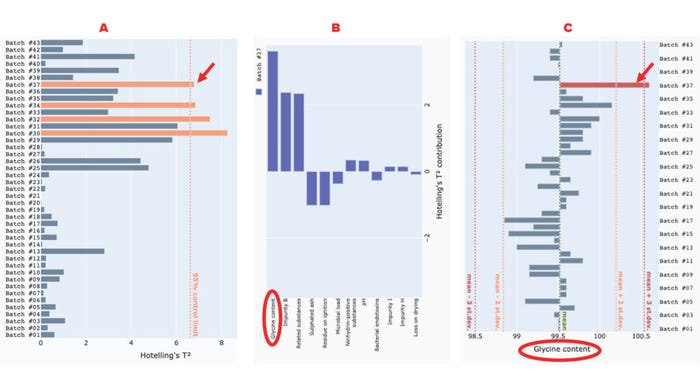
Figure 4: Use of our application to detect and interrogate a Hotelling’s t2 excursion among glycine-powder batches; panel (a) shows a Hotelling’s t2 statistic for glycine-powder batches with a 95% control limit line; (b) presents a contribution plot for batch #37; (c) shows a univariate chart of the “glycine content” attribute for all batches. Red arrows point to the excursing batch (#37), and red ellipses highlight the variable that most strongly contributes to the excursion.
Similarly, SPE can be used to identify uncorrelated excursions in variables, as we see in batches #8, #39, and #42, all three of which exceed the 95% control-limit line (Figure 5a). Inspection of the contribution plot for batch #8 reveals that “loss on drying” is the greatest contributor to the SPE excursion (Figure 5b). The univariate chart for “loss on drying” confirms that batch #8 is indeed an outlier (Figure 5c).
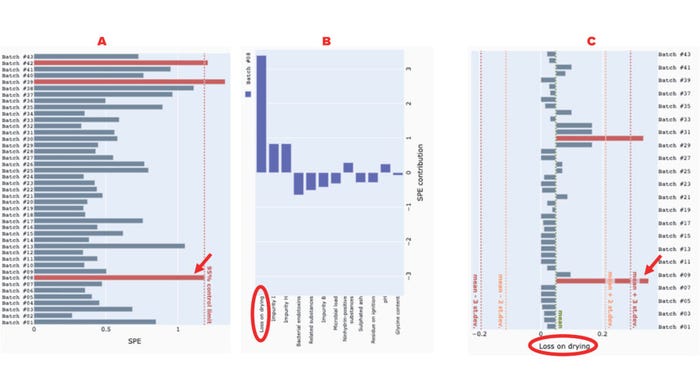
Figure 5: Use of our application to detect and interrogate a squared prediction error (SPE) excursion among glycine-powder batches; panel (a) depicts the SPE of glycine-powder batches, with a 95% control limit line; (b) shows a contribution plot identifying the excursion (batch #8); (c) presents a univariate chart of the “loss on drying” attribute for all batches. Red arrows point to the excursing batch (#8), and red ellipses highlight the variable that most strongly contributes to the excursion.
Note that the control limits displayed here are derived statistically from historical data and do not reflect conventional control limits defined for the given process. SMEs must continue their investigations to determine excursions’ causes and potential consequences.
Discussion
Our goals during this project were to develop and implement an MVDA-based software application to streamline monitoring of raw materials as part of a broader CPV program. The application depends on cloud technologies, and we created an interactive user interface to enable effective interrogation of the multivariate excursion-detection metrics, helping users to identify underlying univariate causes. We demonstrated the application’s usefulness with examples of excursion detection for glycine powder, a frequently used raw material in biomanufacturing processes. Users estimated that the application reduced data collection and evaluation from 30–40 hours (three to four hours per variable, for >10 variables) to 10–15 minutes.
Key to the application’s development was regular interaction among members of a cross-functional team comprising process experts (including production scientists and engineers), data scientists, and cloud-technology engineers. When developing the application, it was particularly important to engage SMEs about the significance of available raw-material attributes considering differences in reporting standards over time, across different teams, and according to regional regulatory commitments.
Future data-science applications could be accelerated by the establishment of consistent standards before data collection.
Adopting an agile development methodology greatly facilitated routine engagement among process experts and other SMEs. Starting with a set of solid user requirements, we quickly developed a prototype, which key stakeholders in biologics manufacturing tested. Their feedback was critical in driving a new cycle of development to implement further enhancements. An iterative technology-development methodology such as what we used can address evolving needs of end users while providing them with a functional application for process-monitoring tasks. Noteworthy features driven by user interaction include contribution-plot sorting, SME-provided informational tooltips, and downloadable data tables.
Software-engineering best practices such as object-oriented programming, version control, and in-line code documentation were key to ensuring agile application development. Open-source tools for interface design enabled the team to address custom stakeholder requirements that could not be accommodated easily within the limitations of commercial, proprietary software.
The application was developed largely without writing hypertext markup language (HTML), cascading style sheets (CSS), or JavaScript. Using the Dash library, all application logic, including interactivity, could be expressed entirely in Python. That allowed for easy integration of Python-based libraries — e.g., for data retrieval and on-the-fly calculations. More complex interactivity did require careful design, but the breadth of available tutorials and community support helped to mitigate difficulties.
Although open-source tools provide substantial flexibility to help technology-development groups meet custom end-user requirements, the number of applicable technologies is overwhelming. Significant effort was invested into identifying the tools most suitable for this application and beyond, with consideration of the strict requirements of a good manufacturing practice (GMP) environment. We anticipate that early adoption of best practices will facilitate rigorous testing and validation activities.
Although much of the application was developed on a personal computer, implementation proved to be complicated because of inconsistencies between the local programming environment and the target cloud system. Consistent, efficient implementation requires establishment of cloud-based computing environments for development, testing, and production.
The utility of raw-materials modeling can be extended beyond CPV by considering direct linking of raw-material properties to models for the unit operations in which they are used, including for downstream processes. Thus, further application could enable holistic process evaluations.
Acknowledgments
We acknowledge support from our colleagues in manufacturing sciences and technology, production, information technology, and biotechnology data science and digitalization with the development and testing of our raw-materials monitoring application.
References
1 Guidance for Industry: Process Validation — General Principles and Practices. US Food and Drug Administration: Silver Spring, MD, 2011; https://www.fda.gov/files/drugs/published/Process-Validation–General-Principles-and-Practices.pdf.
2 Rathore AS, Bhushan N, Hadpe S. Chemometrics Applications in Biotech Processes. Biotechnol. Prog. 27(2) 2011: 307–315; https://doi.org/10.1002/btpr.561.
3 Kourti T. Multivariate Dynamic Data Modeling for Analysis and Statistical Process Control of Batch Processes, Start-Ups, and Grade Transitions. J. Chemomet. 17(1) 2003: 93–109; https://doi.org/10.1002/CEM.778.
4 Wold S, et al. The Chemometric Analysis of Point and Dynamic Data in Pharmaceutical and Biotech Production (PAT): Some Objectives and Approaches. Chemomet. Intell. Lab. Sys. 84(1–2) 2006: 159–163; https://doi.org/10.1016/j.chemolab.2006.04.024.
5 Kirdar AO, et al. Application of Multivariate Analysis Toward Biotech Processes: Case Study of a Cell-Culture Unit Operation. Biotechnol. Prog. 23(1) 2007: 61–67; https://doi.org/10.1021/bp060377u.
6 PAT: A Framework for Innovative Pharmaceutical Development, Manufacturing, and Quality Assurance — Guidance for Industry. US Food and Drug Administration: Silver Spring, MD, 2004; https://www.fda.gov/regulatory-information/search-fda-guidance-documents/pat-framework-innovative-pharmaceutical-development-manufacturing-and-quality-assurance.
7 Q8(R2). Guidance for Industry: Pharmaceutical Development. US Food and Drug Administration: Silver Spring, MD, 2009; https://www.fda.gov/regulatory-information/search-fda-guidance-documents/q8r2-pharmaceutical-development.
8 European Pharmacopoeia: Adoption of a New General Chapter on Multivariate Statistical Process Control. European Directorate for the Quality of Medicines and HealthCare: Strasbourg, France, 11 May 2020; https://www.edqm.eu/en/news/european-pharmacopoeia-adoption-new-general-chapter-multivariate-statistical-process-control.
9 Discoverant User’s Guide. Aegis Analytical Corporation, 2001; http://pearsontechcomm.com/samples/Discoverant_Users_Guide.pdf.
10 Amazon Web Services. Amazon: Seattle, WA, 2023; https://aws.amazon.com.
11 Maiti S, Spetsieris K. Advanced Data-Driven Modeling for Biopharmaceutical Purification Processes. BioProcess Int. 19(9) 2021: 44–51; https://bioprocessintl.com/manufacturing/process-monitoring-and-controls/advanced-data-driven-mvda-modeling-for-biopharmaceutical-purification-processes.
12 Jackson JE. A User’s Guide to Principal Components (second edition). John Wiley: New York, NY, 2003.
13 Eriksson L, et al. Appendix II: Statistics. Multi- and Megavariate Data Analysis: Basic Principles and Applications. Umetrics Academy: Umeå, Sweden, 2013: 425–468.
14 Mnassri B, et al. Fault Detection and Diagnosis Based on PCA and a New Contribution Plot. IFAC Proc. Vol. 42(8) 2009: 834–839; https://doi.org/10.3182/20090630-4-ES-2003.00137.
15 Dash Python User Guide. Plotly: Montréal, Quebec, Canada, 2023; https://dash.plotly.com.
16 Open-Source Graphing Libraries. Plotly: Montréal, Quebec, Canada, 2023; https://plotly.com/graphing-libraries.
17 Flask User’s Guide. Pallets Projects, 2023; https://flask.palletsprojects.com.
18 Dash Bootstrap Components. Faculty.ai, 2023; https://dash-bootstrap-components.opensource.faculty.ai.
19 Domino Data Lab. Domino: San Francisco, CA, 2023; https://dominodatalab.com.
20 Bro R, et al. Cross-Validation of Component Models: A Critical Look at Current Methods. Anal. Bioanal. Chem. 390, 2008: 1241–1251; https://doi.org/10.1007/s00216-007-1790-1.
Hao Wei is a principal data scientist, John Mason is a senior data scientist, and Konstantinos Spetsieris is head of data science and statistics, all at Bayer US LLC, 800 Dwight Way, Berkeley, CA 94710; 1-510-705-4783; [email protected]; http://www.bayer.com.
You May Also Like


