Voices of Biotech
Podcast: MilliporeSigma says education vital to creating unbreakable chain for sustainability
MilliporeSigma discusses the importance of people, education, and the benefits of embracing discomfort to bolster sustainability efforts.
Host cell proteins (HCPs) can be present in significant amounts in biological products through copurification with a recombinant protein-drug substance. Purified active ingredients developed for human use must be free of all contaminants — including residual HCPs — to minimize the incidence of immunogenicity against a drug product or its trace contaminants (1).

HCP assays allow for monitoring host-related impurities during product development and process development. Most are in the enzyme-linked immunosorbent assay (ELISA) format for detecting complex mixtures of proteins and allowing for a reasonable estimate of HCP mass in a drug substance. HCP limits have not been set by regulatory agencies. They are determined case-by-case depending on drug dosage, route of delivery, dosing frequency, and so forth. However, most HCP levels are 2).
PRODUCT FOCUS: PLANT-DERIVED HUMAN BIOLOGICS
PROCESS FOCUS: DOWNSTREAM PROCESSES AND PURIFICATION
WHO SHOULD READ: ANALYTICAL PROTEIN/PROCESS SCIENTISTS, QA/QC
KEYWORDS: SAFFLOWER PLANT, HOST CELL PROTEIN, IMPURITIES, BIOLOGICS, QUALITY CONTROL, ASSAY DEVELOPMENT, ANALYTICAL TESTING
LEVEL: INTERMEDIATE
SemBioSys Genetics Inc. is a Canadian biotechnology company developing protein-based pharmaceuticals using the safflower plant as a host for its proprietary oilbody-oleosin expression and purification technology. SemBioSys has used its plant expression platform to successfully produce human insulin (3). The insulin has been tested in a human clinical trial (4) establishing bioequivalence with reference-listed insulin and human Apo AIMilano (5), which has demonstrated efficacy in preclinical testing.
Many HCP assays are commercially available and are useful for proteins purified from common expression systems such as Chinese hamster ovary (CHO) cells (6) or bacterial systems. Because SemBioSys uses a plant-based protein expression system, we developed safflower-specific antibodies and reagents to quantitate safflower HCPs in purified plant-derived human proteins.
Antigen Selection and Preparation
We chose the antigen used to immunize rabbits to reflect null vector-transformed safflower plant cells. Briefly, we transformed safflower plants using the plant expression vector pSBS4004, which contained the phosphinothricin acetyltransferase (PAT) gene for phosphinothricin (PPT) resistance. That allowed for herbicide selection of positively transformed plants. This represented the HCP background for several of SemBioSys’s safflower-derived protein biologics. We selected plants for PPT resistance over multiple generations and collected mature seeds.
Individual seeds from six lots of seed were sterilized, dehulled, ground in PBS, and tested for PAT protein using a dip-stick method, following the manufacturer’s instructions (Strategic Diagnostics Inc.). We identified five positive seed lots and used ground slurry of one seed from each lot to generate a mixture of total seed extracts (TSE).
We removed solids from the combined TSE by passing them through glass wool packed into a syringe. The protein content was determined by a BCA assay on a portion of the sample extracted in Tris-SDS buffer. We assessed the protein profile using gel electrophoresis (Figure 1). Antigen was frozen in aliquots containing 500 µg of protein.
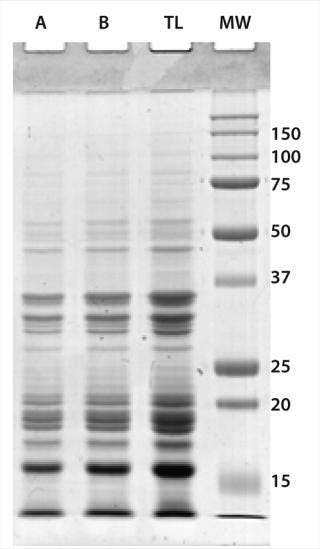
Figure 1: ()
Antibody Development
We made polyclonal antibodies by injecting TSE into five rabbits. Western blot screening the individual serums ensured recognition of the safflower proteins. We combined the serums and isolated the immunoglobulin using immobilized protein A. The purified polyclonal antibody was screened a second time by Western blot and was found to be poorly immunogenic to safflower oleosin proteins (~20 kDa, Figure 2). To supplement the HCP polyclonal, we added two previously made polyclonal antibodies: one raised against the oilbody fraction of TSE (LP3, light phase fraction 3) and one raised against the soluble protein fraction of TSE (HP1, heavy phase fraction 1). This HCP antibody mixture was then adsorbed against USP insulin coupled to an amine reactive NHS ester activated agarose resin (Affinity Biologicals, Ancaster Ontario). We labeled a portion of it with horseradish peroxidase (HRP). Figure 3 shows the final antisafflower HCP polyclonal antibody mix reactivity in Western blotting.
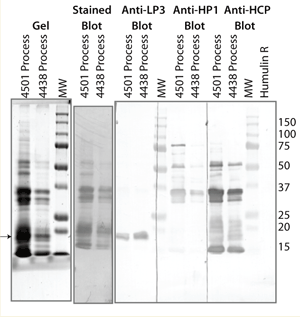
Figure 2:
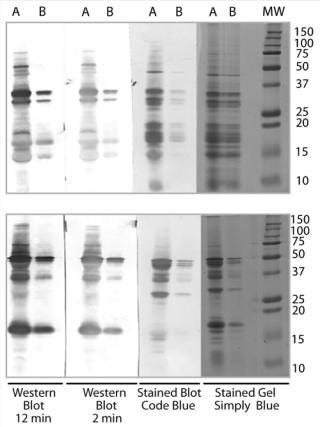
Figure 3: ()
We stored both the capture and detecting versions of the HCP polyclonal mix in glycerol at –80 °C. The final antibody screening blot (Figure 3) shows that the anti-HCP mixed polyclonal antibody recognizes most of the proteins found in the TSE. The simple Tris extraction used to generate the TSE represents the proteins found in the manufacturing processing samples screened in Figure 2.
HCP Standard Preparation
We developed the HCP standard from safflower pSBS4004 seed lots identified previously as being positive for PAT protein. Briefly, five seeds (one from each lot) were dehulled, placed in a single microcentrifuge tube, and ground with a pestle in 50 mM Tris (pH 7.5). Centrifugation removed solids, and a bicinchoninic acid (BCA) assay quantitated the soluble protein. We stored HCP standard extracts at –80 °C in single-use aliquots.
<
p/>HCP Sandwich ELISA Development
The safflower HCP assay was initially developed to test plant-derived human insulin. It was then adapted to test plant-derived human Apo AIMilano using the same antibodies and standards. The HCP assay must not cross-react with any drug products being screened.
Insulin HCP Assay Development
The United States Pharmacopeia insulin monograph (USP 29) (7) provides guidelines on HCP limits in human insulin, which cannot exceed 10 ppm. We developed the initial safflower HCP assay using this criterion.
We determined HCP capture antibody coating using a concentration range of anti-HCP polyclonal mix coated on a C8 Maxisorp plate (Nunc) in 50 mM bicarbonate (pH 9.6) or 50 mM Tris (pH 7.5). The selected capture antibody concentration provided minimal cross reactivity when we added the detecting antibody in the absence of HCP. For coating conditions we diluted the antibody in 50 mM Tris buffer (pH 7.5) and incubated overnight at room temperature.
We tested several blocking buffers, including in-house buffers and commercially available blocking solutions. StartingBlock (PBS) blocking buffer (Thermo Scientific) gave the lowest background noise in the insulin control samples and was used throughout the assay.
During assay development, both reference-standard human insulin (USP) and commercially available human insulins (Humulin R, Eli Lilly and Novolin ge Toronto, Novo Nordisk) were used to assess assay suitability. The commercial insulin drug products repeatedly showed no cross-reactivity with HCP antibodies. However, USP reference-standard insulin routinely reacted in the assay despite the anti-HCP mix being adsorbed against it. Formulation conditions of the powdered insulin were critical in the assay to prevent nonspecific interactions with the HCP antibodies. We solubilized powdered insulin in 0.01N HCl before diluting it with blocking buffer.
HCP standard curves were made in the ~3.5–60 ng/mL range in the absence or presence of 1.9 mg/mL insulin to give a range of 2–30 ppm HCP (Figure 4). Both buffer and insulin alone controls are included in each assay. We optimized the detecting antibody (HRP-labeled HCP polyclonal antibody mix) concentration to give minimal cross-reactivity with the matrix and insulin control samples.
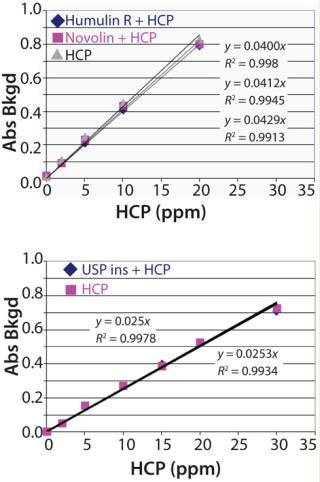
Figure 4: ()
Assay Implementation and Evaluation: Five laboratory staff members performed 38 assays using a preliminary standard operating procedure (SOP) to evaluate the insulin HCP assay. We evaluated HCP standard curves in the presence and absence of USP human insulin and used an insulin-alone control sample to assess matrix effects and background noise. The limit of detection (LOD) for the HCP assay was 1 ppm, the lower limit of quantitation (LLOQ) was 2.5 ppm. And the upper limit of quantitation (ULOQ) was set at 20 ppm.
We determined the specificity and matrix effects of our assay by comparing the absorbance values for the blank samples containing insulin (USP insulin matrix control, 1.88 mg/mL or 50 units/mL) with the absorbance values obtained for the sample diluent (0.01N HCl) without any insulin (no insulin control) in the 38 assays. Both control samples had <6% difference in absorbance values, which indicates that the assay is specific for HCP with no nonspecific interaction with the high amounts of insulin in the matrix.
We assessed the standard curves (1–30 ppm) for goodness of fit by comparing the R2 values for the standard curves generated from HCP in the insulin matrix. The average R2 value obtained for the 38 qualification assays was 0.99, and none of the 38 assays failed the acceptance criteria of an R2 value of ≥0.95.
To assess accuracy, we used HCP standard curves generated in insulin to assess the accuracy of the HCP samples (1, 2.5, 5, 7.5, 10, and 15 ppm) plated in sample diluent alone (0.01N HCl). An average relative error of less than 15% was achieved for each standard. To assess recovery, we used standard curves generated using HCP in sample diluent (0.01N HCl) to predict the concentration of HCP (10 ppm) spiked into insulin. The relative error was <5% when comparing the known amount of HCP spiked in with the amount predicted by the assay.
We determined assay precision using intra-and interassay variability. Intraassay variability was determined from the average %CV obtained for the replicates of each of the standards (1–15 ppm) within a single assay using 5 randomly chosen assays. The %CV was <5% for each standard concentration. We determined the interassay variability by comparing the predicted amount of the 10 ppm and the 2.5 ppm HCP test samples in sample diluent over all assays. The average %CV for the 10 ppm sample was 5%, and the average %CV for the 2.5 ppm sample was 11.8%.
Bench-top, freeze–thaw, and long-term storage sample stability was not tested as part of assay development or qualification. Test samples are analyzed immediately upon receipt. The HCP standard was aliquoted and frozen at –80 °C and thawed immediately before use and discarded after plating. Assay standards were not stored and were plated within 1 hour of preparation.
Apo AIMilano HCP Assay Development: Recombinant Apo AI is the protein component of high density lipoproteins (HDL). The Milano version of that protein, AIM, is a naturally occurring gain of function mutation that confers low cardiovascular disease risk to those individuals who possess it (8). Recombinant AIM is in the early stages of drug development, so there are no set specifications for acceptable HCP levels for Apo AI–based pharmaceutical ingredients. SemBioSys has set a specification for AIM products of not more than 10 ppm HCP.
The capture antibody coating conditions, the multiwell plate, and the HCP standard all remained unchanged from the insulin assay. Because of solubility limitations with AIM, we modified the standard curve to accommodate a maximum concentration of 1.2 mg/mL AIM and ranges from 1.2 to 24 ng/mL HCP (1–20 ppm). We also modified the detecting antibody concentration to increase the assay signal strength and slightly decreased the incubation time. Addition of 0.05% Tween 20 modified the StartingBlock blocking buffer.
Assay Implementation and Evaluation: Two laboratory staff members performed a total of 32 assays to evaluate modifications of the assay from the insulin HCP assay protocol to develop a preliminary SOP for AIM HCP. Using that SOP, we conducted an additional six assays to test the suitability of the AIM HCP assay and the early-stage AIM standard. We evaluated HCP standard curves (1–20 ppm, Figure 5) in the presence and absence of AIM and used an AIM-alone control sample to assess matrix effects and background noise of the assay. Our analysis was complicated slightly by the presence of small amounts of HCP in the AIM standard. LOD for the HCP assay was 1 ppm, LLOQ was 2 ppm, and ULOQ was set at 30 ppm.
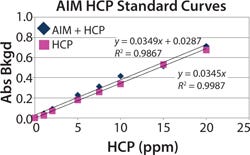
Figure 5:
We determined the specificity and matrix effects of the assay by comparing the absorbance values for the blank samples containing AIM (AIM matrix control, 1.2 mg/mL) with the absorbance values obtained for the sample diluent (blocking buffer) without any AIM. Both control samples had <11% difference in absorbance values, which indicated that the assay is specific for HCP, with no nonspecific interaction of the antibodies with the high amounts of AIM in the matrix.
We assessed the standard curves (1–20 ppm) for goodness of fit by comparing the R2 values for the standard curves generated from HCP in the AIM matrix. The average R2 value obtained for the six qualification assays was 0.97, and none of the preliminary or implementation assays failed the acceptance criteria of an R2 value of ≥0.95.
We determined assay precision using intra-and interassay variability. Intra-assay variability was determined from the average %CV obtained for the replicates of each of the standards (1–20 ppm) within a single assay using the six implementation assays. The %CV was <5% for each standard concentration. We determined the interassay variability by comparing the predicted amount of the 10 ppm and the 2.0 ppm HCP test samples in sample diluent over the six assays. The average %CV for the 10-ppm sample was 5%, and the average %CV for the 2.0 ppm sample was 8.5%.
HCP Assay Validation
The insulin HCP assay qualification described here was intended to meet requirements for release of material to be used in a single-dose phase 1 clinical trial in Europe. Validation of the assay was not require for this trial. Further development would be required to fully validate this assay before its use in more advanced clinical trials and for product registration. That would include full qualification of all reagents used and further demonstration of broad host protein detection through analysis of immunoblots from two-dimensional (2D) electrophoretic gels. The optimized 2D gels/blots are considered the “gold standard” to demonstrate the degree of correspondence of the anti-HCP polyclonal antibodies to the HCP protein mixture that is used as the ELISA reference standard. In addition, all future changes in either the HCP polyclonal or HCP standard would be subjected to reassessment with 2D gels/blots to ensure that the specificity is comparable with the original immunoreagents used to develop and validate the assay.
Assay for QA/QC
SemBioSys has developed an HCP assay specific for its unique safflower plant protein expression system. This assay has been used to assess safflower protein impurities in both safflower-produced human insulin and AIM with minimal changes in the basic assay protocol and reagents.
The insulin HCP assay development was aided by the availability of established HCP limits in the USP insulin monograph (USP 29) and the commercial availability of insulin reference-standard drug substance and commercial drug product, both produced in expression systems other than plants and therefore free of safflower protein. The AIM HCP assay development was made slightly more challenging by the reliance on an early stage in-house AIM standard that contained traces of safflower proteins.
The safflower assay easily detects HCP levels of
About the Author
Author Details
At the time of writing, corresponding author Elizabeth W. Murray was team leader, bioanalytical; Amanda J. Bodero was senior scientist, bioanalytical; Elizabeth Pollock was quality manager; Joseph Wu was president and principal consultant; Frank Visser was scientist, bioanalytical; Maurice M. Moloney was chief scientific officer; and Joseph Boothe was vice president of research and development, all at SemBioSys Genetics. The company has since closed its doors, and the authors are now affiliated with other companies. Information regarding this article can be obtained by contacting the corresponding author at 1208 Kingston St NW, Calgary, Alberta, T2N 3X7; [email protected].
1.) Wolter, J, and A. Richter. 2005. Assays for Controlling Host Cell Impurities in Biopharmaceuticals. BioProcess Int www.bioprocessintl.com/wp-content/uploads/bpi-content/0302ar06_77171a.pdf 2:40-66.
2.) Eaton, LC. 1995. Host Cell Contaminant Protein Assay Development for Recombinant Biopharmaceuticals. J. Chromat. A 705:105-114.
3.) Nykiforuk, CL. 2006. Transgenic Expression and Recovery of Biologically Active Recombinant Human Insulin from Arabidopsis thaliana Seeds. Plant Biotechnol. J 4:77-85.
4.) Boothe, JG. 2009. Analytical Characterization, Safety, and Clinical Bioequivalence of Recombinant Human Insulin from Transgenic Plants, American Diabetes Association, 69th Scientific Sessions.
5.) Nykiforuk, C. 2011. Expression and Recovery of Biologically Active Recombinant Apolipoprotein AIMilano from Transgenic Safflower (Carthamus tinctorius) Seeds. Plant Biotechnol. J 9:250-263.
6.) Krawitz, DC. 2006. Proteomic Studies Support the Use of Multiproduct Immunoassays to Monitor Host Cell Protein Impurities. Proteomics 6:94-100.
7.)The United States Pharmacopeia 29– National Formulary 24, The United States Pharmacopeial Convention, Rockville.
8.) Franceschini, G. 1980. A-IMilano Apoprotein: Decreased High Density Lipoprotein Cholesterol Levels with Significant Lipoprotein Modifications and without Clinical Atherosclerosis in an Italian Family. J. Clin. Invest 66:892-899.
You May Also Like