- Sponsored Content
Visualization and Characterization of Chromatography Structures: Imaging at Packed-Bed and Individual-Bead Scales
Packed-bed chromatography is a vital downstream operation for purifying valuable biological products, including monoclonal antibodies (MAbs) and emergent therapeutic modalities such as viral vectors. Conventional chromatography unit operations in bioprocessing use highly porous microspheres packed into cylindrical columns, purifying complex feed streams through characteristics such as size, charge, and hydrophobicity. The porosity of both a packed bed and its constituent beads relates directly to the intended function and optimal performance in terms of both chemical and physical separation (1).
High-resolution imaging techniques have developed sufficiently to the point at which they can be used to visualize and characterize complex geometries such as packed columns. These methods help us understand the detailed, internal structure of many different materials (2). X-ray computed tomography is an effective method for imaging at nanoscale resolutions in three dimensions (3D) while negating the need to section samples physically. We used that technology to image several commercially available chromatographic resins and packed beds to improve our understanding of how their structures relate to function and performance.
3D Imaging Setup
We imaged three resins consisting of agarose, cellulose, and ceramic base matrices using X-ray computed tomography using two instruments: a Zeiss Xradia 810 Ultra X-ray microscope for individual beads and a Nikon XTH 225 system for packed beds. After critical-point drying, individual beads were adhered to the top of a pinhead for scanning. We captured 1,601 images while rotating each sample, taking 20 hours for each single scan, using two pixel sizes: 64 nm to image entire beads and 32 nm for higher resolution at the expense of limiting the field of view. We also imaged 1-mL prepacked columns at 3-µm pixel size, taking 3,142 images over five hours for each scan. Then we loaded reconstructed volumes into Avizo software (Thermo Fisher Scientific) for digital processing. Samples were binarized into material and void phases for analysis of porosity (expressed as a percentage) and tortuosity (the effective path length through a complex structure, expressed as a ratio, with a value of 1 given to an uninterrupted path).
Packed-Bed Imaging: The ability to visualize the internal structure of a packed bed in the unchanged environment of an unused column improves our understanding of the detailed geometry of real bioprocessing materials. Because X-ray computed tomography is nondestructive and requires no sample preparation, the imaging can capture details of such samples in their nascent state. Optimizing image quality is essential to obtaining the most representative quantitative information. In this study, we achieved that through empirically determining the number of individual radiographs at the best signal/noise ratio achievable while fine-tuning our equipment settings. Figure 1 displays two-dimensional (2D) slices through each type of column, showing clear physical differences among the three base matrices. For example, agarose and cellulose beads are spherical, whereas ceramic particles are less so. Note that in all cases, the beads are neither uniform in size nor arranged into distinct plates.
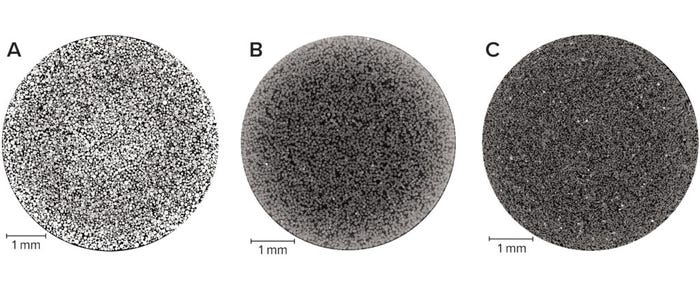
Figure 1: Horizontal slice through 1-mL prepacked beds of chromatography media imaged at a 3-μm pixel size; (A) agarose resin, (B) cellulose resin, (C) ceramic resin — adapted with permission (3).
Generating 3D digital representations of packed beds in chromatography columns enables structural analysis of their key characteristics. Although structural features of columns can be measured using conventional approaches — e.g., a blue dextran pulse for determining interbead porosity — imaging techniques enable positionally based analyses (3). Shalliker et al. imaged iodine pulses in a time series to visualize chromatography wall effects, in which a radial packing disparity arises from geometrical and frictional interactions close to column walls (4). X-ray computed tomography reconstructions of the three column types enabled us to measure interbead porosity and tortuosity at the edge and center of each column. Figure 2 provides results from our analysis.
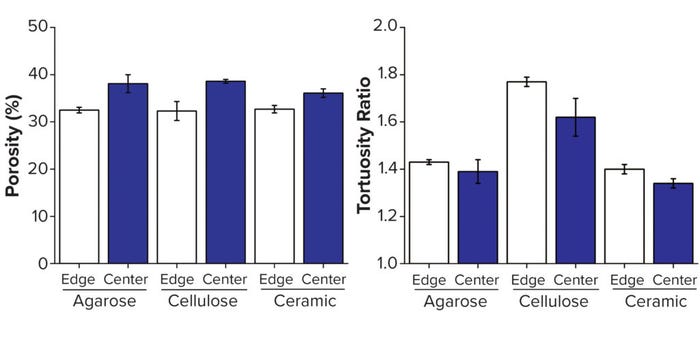
Figure 2: Structural analysis of three resins, with edge measurements defined as the volume within 250 μm of the column wall; (A) porosity, (B) tortuosity — adapted with permission (3).
We observed that interbead porosity was lower at the edge than the center for all three resins, which demonstrates further their radial packing disparities. Indicating the effective path length that the mobile phase must travel in a chromatographic process, tortuosity was another factor of critical interest in this study because of the importance of transport phenomena between and within chromatography beads. Historically, tortuosity has been measured indirectly using a relationship to overall sample porosity, as described by Tjaden et al. (5). The advent of digital volumes from 3D imaging has enabled use of the complex geometries of these materials to simulate tortuosity. In all cases, the tortuosity measured in this study was lower at the edge of the columns than at their centers.
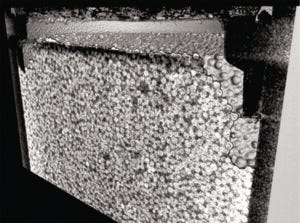
Figure 3: 1-mL cellulose packed bed following compression from excessive flow rates — adapted with permission (6).
Packed-Bed Compression: We applied X-ray computed tomography to investigate how a packed bed of chromatographic media changes during and after compression. Frictional support through wall effects is diminished as columns are scaled up to larger diameters, which can lead to compression when combined with relatively soft resin materials such as cellulose and mobile phases containing foulants. To deliberately compress columns in this study, we passed 20% ethanol through a 1-mL prepacked bed at a reasonable flow rate of 1 column volume (CV) per minute and an excessive flow rate of 10 CV/min (6). Figure 3 shows an irreversibly compressed packed bed, with an obvious gap between the new bed height and the surrounding plastic molding.
As above, we collected 3D data sets to evaluate interbead porosity and tortuosity. Columns were imaged before, during, and after flow at both 1 and 10 CV/min. To enable capture of high-quality images during flow, a steady state had to be reached at which beads were no longer moving; even so, we detected a noticeable reduction in signal/noise ratio while imaging the live flow. As Figure 4 indicates, the porosity measured for the top 3 mm of the bed is reasonably consistent at 1 CV/min, but a clear reduction in porosity is apparent during 10-CV/min flow (reverting after flow ceased).
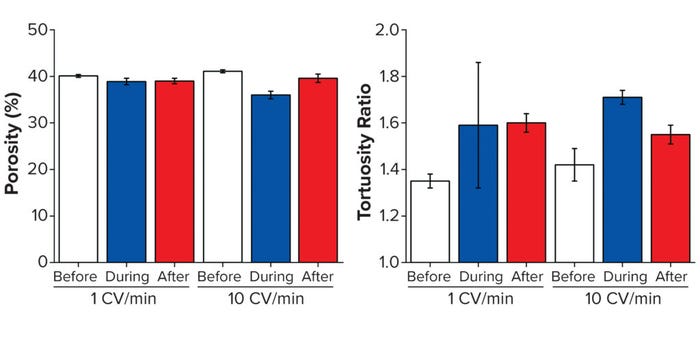
Figure 4: Structural analysis of three resins before, during, and after flow-induced compression; (A) porosity, (B) tortuosity — adapted with permission (6).
Individual Bead Imaging: The internal structure of chromatography beads is essential for separation during size-exclusion chromatography as well as for providing a substantial ratio of surface area to volume to bind products and impurities (7). Applying X-ray computed tomography at the nanoscale enabled us to view the internal structure of three types of chromatography beads across their entire diameters (Figure 5). Pores are obvious throughout in each case, with each sample having a distinct geometry.
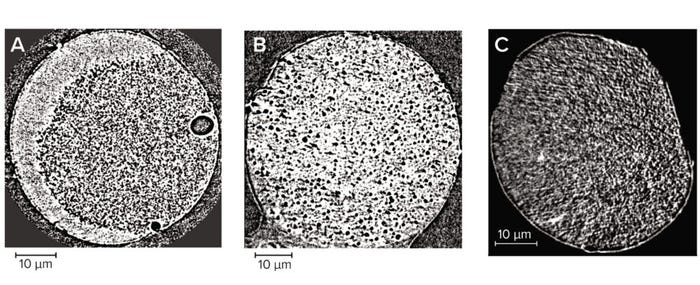
Figure 5: Two-dimensional (2D) slice through individual chromatography beads imaged at 64-nm pixel size; (A) agarose resin, (B) cellulose resin, (C) ceramic resin — adapted with permission (8).
For acquisition of the most representative images and the best results from their analysis, the finest features must be distinguishable within each chromatography bead. That requires an appropriate resolution, so for this study we improved the pixel size from 64 nm (Figure 5) to 32 nm (Figure 6). Far more detail could be seen on the chromatography beads at the improved resolution, which was noticeable particularly for the cellulose sample. Note that only the largest spherical pores can be seen in Figure 5b, whereas those larger pores are surrounded by more detailed structures in Figure 6b. Imaging at improved resolution requires sacrifice in other aspects, however, most noticeably the substantially reduced field of view that images only a small region of each bead.
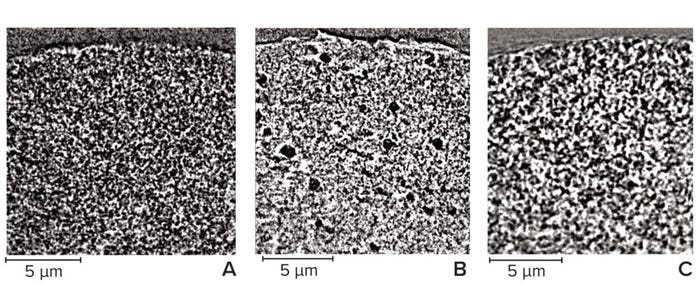
Figure 6: Vertical slice through a subsection of chromatography beads imaged at 32-nm pixel size; (A) agarose resin, (B) cellulose resin, (C) ceramic resin — adapted with permission (8).
We compared the two pixel sizes for both porosity and pore size (Figure 7). Porosity measurements were reasonably consistent at both pixel sizes; however, the difference in average pore size is clear. Thus, imaging focused on capturing an entire sphere within the field of view is insufficient for detecting the finest features within each chromatography bead. Therefore, achieving suitable resolution of a given sample is essential for representative visualization and characterization, but that often comes with drawbacks, including a decreased field of view and increased scan times.
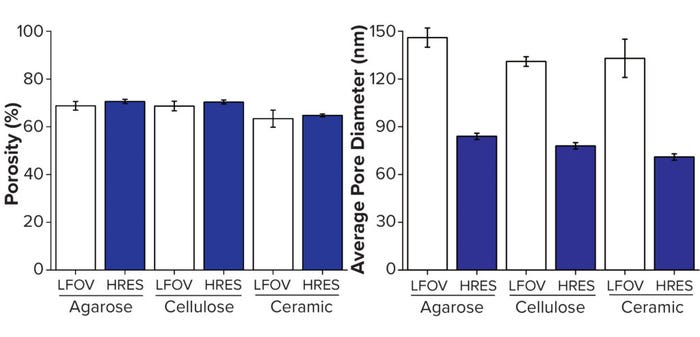
Figure 7: Structural analysis of three individual beads; (A) porosity, (B) average pore size; LFOV = large field of view at 64-nm pixel size (Figure 5), HRES = imaging at higher resolution of 32-nm pixel size (Figure 6) — adapted with permission (8).
Outlook
High-resolution X-ray computed tomography allows us to visualize and characterize the detailed, internal structures of chromatographic packed beds and individual beads for a range of industrially relevant resins. Representing 3D geometries and associated flow paths of real materials enables analysis of complex transport properties through porous media using state-of-the-art simulation software.
In this study, we focused on tortuosity. Improving the biopharmaceutical industry’s understanding of how structure relates to function and performance will influence design and fabrication of bioprocessing and biopurification materials across multiple scales. That is of critical and timely importance as multiple emerging therapeutic modalities provide exciting opportunities in the clinic while presenting substantial challenges to manufacturing at high process yields with acceptable product quality.
Acknowledgments
This research was funded by the UK Engineering and Physical Sciences Research Council (EPSRC) grant EP/L01520X/1 and UK Research and Innovation (UKRI) grant MR/W004399/1 through an Innovation Scholarship. We’re grateful to Nigel Jackson and Dave Hayden at Cytiva in addition to Francesco Iacoviello and Paul Shearing at University College London’s (ECL’s) Electrochemical Innovation Laboratory. This research was undertaken as part of the UCL-Pall Centre of Excellence, established in 2018.
References
1 Angelo JM, et al. Characterization of Cross-Linked Cellulosic Ion-Exchange Adsorbents: 1. Structural Properties. J. Chromatog. A 319, 6 December 2013: 46–56; https://doi.org/10.1016/j.chroma.2013.10.003.
2 Maire E, Withers PJ. Quantitative X-Ray Tomography. Int. Mater. Rev. 59(1) 2014; https://doi.org/10.1179/1743280413y.0000000023.
3 Johnson TF, et al. X-Ray Computed Tomography of Packed Bed Chromatography Columns for Three Dimensional Imaging and Analysis. J. Chromatog. A 1487, 3 March 2017: 108–115; https://doi.org/10.1016/j.chroma.2017.01.013.
4 Shalliker RA, Broyles S, Guiochon G. Physical Evidence of Two Wall Effects in Liquid Chromatography. J. Chromatog. A 888(1–2) 2000: 1–12; https://doi.org/10.1016/S0021-9673(00)00517-3.
5 Tjaden B, et al. On the Origin and Application of the Bruggeman Correlation for Analysing Transport Phenomena in Electrochemical Systems. Curr. Opin. Chem. Eng. 12, May 2016: 44–51; https://doi.org/10.1016/j.coche.2016.02.006.
6 Johnson TF, et al. Packed-Bed Compression Visualisation and Flow Simulation Using an Erosion-Dilation Approach. J. Chromatog A 611, 25 January 2020: 460601; https://doi.org/10.1016/j.chroma.2019.460601.
7 Tatárová I, et al. Characterization of Pore Structure of Chromatographic Adsorbents Employed in Separation of Monoclonal Antibodies Using Size-Exclusion Techniques. J. Chromatog. A 1193(1–2) 2008: 129–135; https://doi.org/10.1016/j.chroma.2008.04.023.
8 Johnson TF, et al. Three-Dimensional Characterisation of Chromatography Bead Internal Structure Using X-Ray Computed Tomography and Focused Ion-Beam Microscopy. J. Chromatog. A 1566(7) 2018: 79–88; https://doi.org/10.1016/j.chroma.2018.06.054.
Thomas Johnson is a senior research fellow, and corresponding author Daniel Bracewell is a professor of bioprocess analysis at University College London, Bernard Katz Building, Gower Street, London WC1E 6BT; [email protected].
You May Also Like


