Perfusion’s Role in Maintenance of High-Density T-Cell Cultures
T-cell therapy is a rapidly growing field of personalized medicine, attracting the interest of venture capitalists and pharmaceutical companies alike. Such therapies exploit T cells’ innate abilities to protect against pathogens as well as to seek and destroy cancerous cells. Although many different forms of T-cell therapies are currently in clinical trials, they all follow a common protocol: T cells are isolated from a patient, modified and expanded in a laboratory setting, and then infused back into the same patient to fight his or her disease (1).
 T-cell therapies that treat tumors and leukemia represent the majority of those in clinical trials. Isolating tumor-specific T cells from a patient is inherently challenging, especially because the majority of circulating T cells express a unique receptor of their own. Two approaches have been developed to overcome this challenge. For some solid tumors, T cells can be found embedded in the tumor mass, so those tumor-infiltrating lymphocytes (TILs) can be isolated from a biopsy (2). Alternatively, T cells isolated directly from peripheral blood can be genetically modified by laboratory technicians to express tumor-specific chimeric antigen receptors (CARs) (3). Although TILs and CAR-T cells have different origins, both require activation and expansion in a laboratory to generate a sufficient dose of cells for transferring back into a patient.
Patient doses for anticancer T-cell therapies are highly variable, ranging from 10 to 100 billion cells. Generating so many cells for a single patient can present logistical and technical difficulties. Traditional, labor-intensive tissue-culture techniques require significant laboratory space and use open systems that carry the risk of adventitious contamination. As such, cell therapy manufacturers have adopted many principles of the bioprocess industry, including the use of bioreactors for cell cultivation. Rocking-platform bioreactors are one example, in which the combination of rocking agitation and perfusion media exchange can allow high cell concentrations to be reached. Using such bioreactors, a therapeutic dose can be generated by a single 1-L culture for either TILs or CAR-T cells (4, 5).
Although cell manufacturing in bioreactors offers the benefits of closed, single-use automated systems, their culture conditions must be optimized for primary T cells. Differences are distinct between culturing immortalized cell lines for protein production and primary T cells for infusion into patients. For example, at the end of T-cell therapy cultures, cell populations must be viable, whereas cell integrity is of secondary concern for bioprocess manufacturing.
Like all animal cells, primary T cells are sensitive to sheer stress. So agitation rates in bioreactors need to be optimized to protect these cells from damage while keeping the culture aerated and cells in suspension (6). Similarly, media perfusion rates need to be optimized. Media used to culture T cells are complex, often with proprietary formulae, and therefore expensive. Manufacturers need to ensure that sufficient media are used to maintain cell health and growth while ensuring that the culture process remains economically viable.
We wanted to understand the impact of media perfusion on high- density T-cell cultures in detail. So we used the Xuri cell expansion system (a rocking bioreactor) to grow primary T cells with and without media perfusion. We analyzed the impact of perfusion on cell growth and viability, as well as its role in controlling key metabolites and growth factors.
Materials and Methods Isolation of PBMCs: Blood samples came from healthy donors in accordance with approval from the Welsh Blood Service and the UK Human Tissue Authority (license #12584). We isolated peripheral blood mononuclear cells (PBMCs) from the blood using Ficoll-Paque PLUS medium (GE Healthcare) and then cryopreserved them before culturing. Each experiment described herein used cells from a separate, unique donor.
Static Culture: Table 1 overviews our culture process. For each bioreactor inoculate, we thawed 0.5 × 10⁶ frozen PBMCs, washed them twice, and cultured them in T225 flasks at 1 × 10⁶ cells/mL in a complete medium: X-VIVO 10 serum-free medium (Lonza) supplemented with 5% heat- inactivated human serum (TCS Biosciences), 2-mM GlutaMAX l-glutamine (Life Technologies), 100 U/mL penicillin (Life Technologies), 100 μg/mL streptomycin (Life Technologies), and 20 ng/mL of interleukin-2 (Peprotech). We added CD3/CD28 T-cell expander beads (Life Technologies) to the culture medium at a ratio of 3:1 (beads to CD3+ T cells). After three days in a humidified incubator at 37 °C, cells were counted and maintained at 0.5 × 10⁶ cells/mL by media addition for two more days.
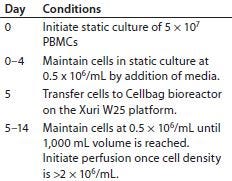
Table 1: Process for culturing primary T cells with the Xuri W25 cell expansion system
To test the effects of lactic acid, we grew T cells for five days in those static culture conditions before washing and replating them in a 24-well plate with fresh complete media and synthetic lactic-acid concentrations of 0–40 mM using L1875l-lactic acid solution, (Sigma Aldrich). The T cells were incubated in a humidified unit at 37 °C for 24 hours before cell counting and calculation of expansion and viability.
Cell Expansion System Culture: We placed a Cellbag bioreactor (GE Healthcare) on either a W25 or W5 Xuri cell expansion system (GE Healthcare) filled with 5% CO2, and connected it to a reservoir of complete media and a waste bag. After adding complete medium to the bag, we allowed it to equilibrate to 37 °C for two hours. Then we set the rocking rate to 15 rpm at a 6° rocking angle and inoculated T cells from a five-day static culture into the bag diluted to a concentration of 0.5 × 10⁶ cells/mL. T cells were maintained at 0.5 × 10⁶ cells/mL by adding complete media to the bag until a final maximum volume of 1,000 mL was reached (usually within 24 hours of bioreactor inoculation), after which we left them to concentrate. When cell density reached a minimum of 2 × 10⁶ cells/mL, we enabled perfusion at rates listed in Table 2. Nine days of Cellbag culture brought the total (static and bioreactor) culture period to 14 days.

Table 2: Perfusion rates for 1-L bioreactor cultures of primary T cells
For experiments with a pH-control function, we used bags containing an embedded pH optical sensor. A reservoir of 0.1 M NaOH (Sigma Aldrich) was connected to such bags through an additional pump unit. For experiments substituting perfusion with IL-2 injections, the amount of IL-2 added to each bioreactor was equivalent to the amount that would otherwise have been added through media perfusion. For example, at a perfusion rate of 500 mL/day using media supplemented with 20 ng/mL of IL-2, the total IL-2 amount would be 10 μg/day. So for injection, we diluted IL-2 in 5 mL of X-Vivo 10 medium and added it using a syringe connected to the spare port on the bioreactor bag.
Cell Counting and Viability: We counted cells using either a Vi-Cell automated cell viability analyzer (Beckman Coulter), which uses trypan blue exclusion to determine viability, or a Nucleocounter (Chemometec) based on propidium iodide fluorescence.
Biochemical Analysis: We measured lactate, ammonia, glucose, and pH from culture supernatants using either a BioProfile 400 bioanalyzer (Nova Biomedical) or a YSI 7100MBS bioanalyzer (Xylem).
Calculating Cell-Specific Production of Lactate and Ammonia: We determined cell-specific production of lactate and ammonia by calculating the net amount of those metabolites produced each 24 hours — (M1 – M0)V + (M1 × perfusion volume), where M1 is the metabolite concentration at a given time point, M0 is the metabolite concentration at the previous time point), and V is the total volume of the bioreactor — divided by the integral of viable cell number over time (determined according to the trapezium rule). We then compared the sum of daily metabolite production per cell in perfused cultures with that in nonperfused culture to calculate a final ratio.
Enzyme-Linked Immunosorbent Assay (ELISA): We measured IL-2 concentrations from culture supernatants using a human IL-2 V-PLEX ELISA kit (Mesoscale Diagnostics) according to the manufacturer’s instruction. Using ≤20-fold sample dilutions ensured that samples containing IL-2 fell within the assay’s calibrated range. We ran our samples in triplicate and calculated the mean and standard deviation of each one.
Results and Discussion
To understand the role that perfusion can play in maintaining high-density T-cell cultures, we set up parallel 1-L bioreactor cultures inoculated by a common static starting culture. For one bioreactor, we initiated media perfusion once the cell density rose above 2 × 10⁶ cells/mL, and in the other bioreactor no media addition or exchange occurred. We cultured our T cells for 14 days — five days in static culture followed by nine in the bioreactors — and recorded the number of total viable cells and cell viability every day (Figure 1).
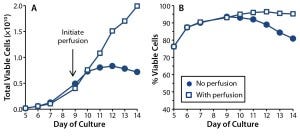
Figure 1: T-cell growth (A) and (B) viability were compared in 1-L rocking bioreactor cultures with (squares) and without (dots) media perfusion.
With perfusion, the cells continued to expand throughout that entire bioreactor period, reaching densities of 20 × 106 viable cells/mL (or 2 × 10¹⁰ total viable T cells in a 1-L culture), with the population being 95% viable at culture day 14. In the absence of perfusion, however, growth arrest occurred between culture days 10 and 11, and cell densities reached no higher than 8 × 10⁶ cells/mL. By the end of those cultures, only 80% of the T cells were viable. These results demonstrate an absolute requirement for media perfusion to expand healthy T-cell cultures to the large cell numbers required for therapy.
One key function of media perfusion is to remove unwanted and potentially inhibitory metabolites from a culture. Bioprocessors often monitor two key metabolites: lactate (the product of glucose metabolism) and ammonia (the product of glutamine metabolism). Both metabolites induce growth arrest and toxicity in hybridoma cell lines. For lactate, the concentration at which growth inhibition occurs in such cells is 33–55 mM (7, 8). Ammonia concentrations of 2–10 mM have been found to cause a 30–75% reduction in growth rate for a range of immortalized cells (9). Studies examining the effects of lactate and ammonia on growth of primary cells are limited, but one study of hematopoietic stem cells showed that proliferation ceased when lactate concentrations exceeded 20 mM (10). Another study of cytotoxic T lymphocytes (CTLs) found that 20 mM of lactic acid inhibited their growth, survival, cytokine secretion, and cytotoxicity (11). Both studies demonstrate an increased sensitivity to lactate in primary cells over that of immortalized cell lines.
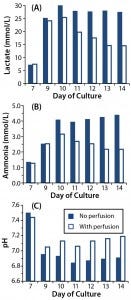
Figure 2: Effect of perfusion on metabolite accumulation in T-cell cultures; (A) lactate concentrations, (B) ammonia concentrations, and (C) pH were measured in T-cell cultures for which perfusion was enabled (open square) or disabled (closed square).
We took supernatant samples from bioreactor cultures with and without perfusion and analyzed them daily for those metabolites (Figures 2A and 2B). In the perfused culture, lactate concentrations reached 25 mmol/L at day 10 before dropping to 15 mmol/L; in the nonperfused culture, lactate concentrations reached 30 mmol/L by day 10 and remained high (Figure 2A). Similarly, in the perfused culture, ammonia levels peaked at 3 mmol/L at day 10 before dropping; in the nonperfused culture, ammonia concentrations were consistently high at >4 mmol/L (Figure 2B).
We found lactate and ammonia metabolites in the nonperfused cultures at concentrations that have inhibited cell growth in other culture systems. Those are likely to have contributed to the growth arrest we observed. However, in perfused culture, lactate and ammonia reached the same concentrations (albeit transiently) at days 9 and 10. Although no growth arrest was obvious in that culture, the metabolites could have been having some detrimental effect. We investigated that by initiating a perfusion regime two days earlier (culture day 7 rather than day 9) in later experiments.
To decouple the deleterious effects of lactate from ammonia, we tested its effect alone on T-cell growth and viability. To do that, we plated T cells at their exponential growth phase in fresh media mixed with synthetic lactic acid (0–40 mM) and cultured them for 24 hours before measuring cell counts and viability. Results showed that at 20 mM of lactic acid (pH 6.6, data not shown), growth was inhibited, and at 30 mM (pH <6.6) both growth inhibition and a loss of cell viability occurred (Figure 3). Our results indicate that T cells are sensitive to lactic-acid concentrations as low as 20 mM. So perfusion strategies should be set to ensure that lactate levels remain below that concentration.
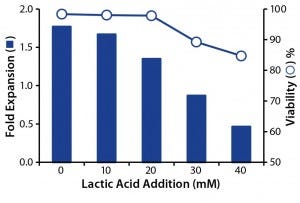
Figure 3: Effect of lactic acid on T-cell growth and viability; T-cells were cultured with increasing concentrations of lactic acid, and the effects of fold expansion (bar) and viability (circle) were determined after 24 hours.
One consequence of lactate build- up in cell culture is medium acidification (8). Indeed, our measurements show that pH in the nonperfused cultures fell to 6.8 by day 9 (Figure 2C). Low pH can inhibit cell proliferation both in vitro (12) and in vivo (13), so it may be contributing to the growth arrest observed in our nonperfused culture. We wanted to determine whether maintaining a constant pH in the T-cell cultures could overcome the growth inhibition we had observed in nonperfused cultures.
So we set up parallel bioreactor cultures from a five-day common static culture. In the control bioreactor, perfusion was enabled at culture day 7 (two days after bioreactor inoculation). With this perfusion regime, we aimed to keep ammonia concentrations <2.0 mM and lactate concentrations <20 mM. In the test bioreactor, the culture was not perfused, but we initiated pH control on day 7. Using CO2 and a 0.1 M NaOH reservoir attached to the bioreactor, we maintained the pH at 7.1–7.2, which is considered optimal for proliferation of primary T cells (14).
Although pH in our nonperfused culture remained stable from day 7 (Figure 4A), growth arrest and loss of cell viability still occurred (Figure 4B–C). Thus, counteracting the effects of lactic acid by adjusting pH did not compensate for a lack of perfusion. As with the previous experiment’s nonperfused culture, lactate concentrations reached 30 mM and ammonia concentrations reached 4 mM (Figure 4D and 4E). Such high concentrations of ammonia probably contributed to poor cell growth and viability, but we haven’t directly tested that hypothesis.

Figure 4B–E: Effect of controlling pH in T-cell cultures with perfusion (open square) and without (dot); (B) T-cell growth and (C) viability were monitored throughout, as were concentrations of (d) lactate and (e) ammonia. Dashed lines in D and E represent metabolite concentrations above which detrimental effects may be observed.
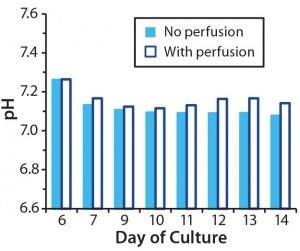
Figure 4A: Effect of controlling pH in T-cell cultures with and without perfusion; in cultures without perfusion, pH was maintained at a constant level through addition of NaOH.
For the perfused bioreactor, lactate and ammonia concentrations were higher than desired (24.5 mM and 2.2 mM, respectively) despite our initiating perfusion on day 7. But that did not appear to affect T-cell proliferation or viability, and growth kinetics were similar for both experiments (Figures 1 and 4).
Having demonstrated the importance of perfusion in controlling metabolite concentration, we wanted to investigate its role in growth factor provision. Glucose is an important energy source, with aerobic glycolysis the major metabolic pathway used by rapidly dividing T cells (15). As cell concentration increases, so too does the rate of glucose consumption. Media perfusion ensures a continuously available supply of glucose.
We measured glucose concentration in both perfused and nonperfused bioreactor cultures (Figure 5A). Lonza’s X-vivo 10 medium has a high glucose concentration of 4.5 g/L. Although glucose concentrations dropped to 1.5 g/L (8.3 mM) in our nonperfused culture, we did not consider that to limit growth rate. However, the glucose reduction could become significant when using a medium with a 2-g/L starting concentration of glucose.
Interleukin-2 (IL-2) is another key growth factor for T cells, supporting their survival, proliferation, and differentiation (16). Maintaining sufficient IL-2 concentrations through media perfusion throughout a culture is particularly important for T-cell therapies because it enables generation of the large cell numbers needed for a patient dose (17). We collected bioreactor supernatants from T-cell cultures with and without perfusion and assayed those for the growth factor IL-2 (Figure 5B). In the perfused culture, IL-2 concentration remained stable at 5–7 ng/mL; in the nonperfused culture, the concentration dropped over time to undetectable levels by culture day 12.
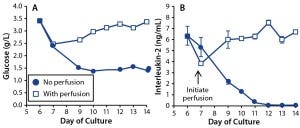
Figure 5: Effects of perfusion on growth-factor maintenance in T-cell cultures; (A) glucose and (B) IL-2 concentrations were measured in T cells cultured with perfusion enabled (open square) or disabled (dot). For IL-2, the graph shows mean and standard deviation of triplicate measurements.
To understand the impact of the IL-2 loss in the nonperfused cultures, we set up a bioreactor culture replacing media perfusion with daily IL-2 injections. A parallel control bioreactor had media perfusion enabled. The amount of IL-2 we injected into the test bioreactor matched that delivered to the control bioreactor through perfusion. We measured cell counts and viability daily (Figure 6). Results show that IL-2 addition partly deferred the growth arrest normally observed in nonperfused cultures, but total T-cell expansion at the end of that culture was only 63% of the control. Because T-cell growth was retarded even with IL-2 injection, it appears that media perfusion is still required for optimal growth.
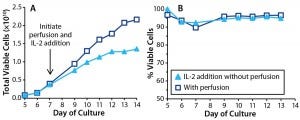
Figure 6: Effects of IL-2 addition in T cells cultured with perfusion (open square) and without (triangle). In cultures without perfusion, IL-2 was injected at 24-hour intervals. T-cell (A) growth and (B) viability were monitored throughout the culture period.
A more dramatic effect of IL-2 addition was seen in T-cell viability, which was consistently >90% and equivalent to that measured in the perfused culture. By contrast, the other nonperfused cultures lost viability to <80% by the experiment’s end. Thus, IL-2 is critically important for maintaining T-cell health in bioreactor cultures, and media perfusion makes sufficient IL-2 available to support the cells.
The growth arrest we observed in nonperfused cultures indicates that perfusion is important for maintaining the metabolic activity of cultured T cells. A difference in their metabolic activity when grown with and without perfusion can be measured directly by calculating the cell-specific rates of lactate and ammonia production. We found that lactate production per viable cell is threefold higher in perfused cultures than in nonperfused cultures, and ammonia production per viable cell is 2.5 times higher (data not shown). Perfusion thus facilitates ongoing glycolysis and glutaminolysis activity in cultured T cells, allowing for high cell densities to be reached. As with any culture system, perfusion rates need to be optimized for growing T cells in bioreactors. And for economic reasons, companies need to ensure that media are not wasted. Perfusion rates throughout this study were designed to keep lactate <20 mM and ammonia <2 mM, concentrations above which were shown to be detrimental to mammalian cells in this and other studies. Despite that, we observed transient spikes of high metabolite concentrations in the perfused cultures, typically several days after bioreactor inoculation. Because those spikes appeared to affect neither T-cell growth rate nor viability, we concluded that the current perfusion regime is sufficient. But if it were critical to keep those metabolites low, then perfusion could be initiated earlier (e.g., once cell density had reached 1 × 10⁶/mL rather than 2 × 10⁶/mL) or the volume of perfused media could be increased (e.g., from 500 mL/day to 750 mL/day). Either strategy would increase the amount of media used and therefore increase costs.
The Mode of Choice
Our data demonstrate a critical role for perfusion in maintaining T-cell bioreactor cultures. It removes toxic metabolites that inhibit cell growth, such as lactate and ammonia. Perfusion also makes sufficient nutrients and growth factors available to proliferating T cells. These effects allow cells to be grown at densities far higher than what are achievable with traditional tissue-culture techniques. Adoption of bioreactors to culture T cells for therapeutic purposes will continue apace. The technology offers scalable, closed, and automated solutions for a manufacturing environment. Determining optimal conditions for T cells grown in bioreactors will be key to establishment of an emerging T-cell therapy industry.
References
1 June CH. Adoptive T Cell Therapy for Cancer in the Clinic. J. Clin. Invest. 117(6) 2007: 1466–1476.
2 Lee S, Margolin K. Tumor-Infiltrating Lymphocytes in Melanoma. Curr. Oncol. Rep. 14(5) 2012: 468–474.
3 Sadelain M, Brentjens R, Riviere I. The Basic Principles of Chimeric Antigen Receptor Design. Cancer Discov. 3(4) 2013: 388–398.
4 Sadeghi A, et al. Large-Scale Bioreactor Expansion of Tumor-Infiltrating Lymphocytes. J. Immunol. Meth. 364(1–2) 2011: 94–100.
5 Hollyman D, et al. Manufacturing Validation of Biologically Functional T Cells Targeted to CD19 Antigen for Autologous Adoptive Cell Therapy. J. Immunother. 32(2) 2009: 169–180.
6 Carswell KS, Papoutsakis ET. Culture of Human T Cells in Stirred Bioreactors for Cellular Immunotherapy Applications: Shear, Proliferation, and the IL-2 Receptor. Biotechnol. Bioeng. 68(3) 2000: 328–338.
7 Kromenaker SJ, Srienc F. Effect of Lactic Acid on the Kinetics of Growth and Antibody Production in a Murine Hybridoma: Secretion Patterns During the Cell Cycle. J. Biotechnol. 34(1) 1994: 13–34.
8 Ozturk SS, Riley MR, Palsson BO. Effects of Ammonia and Lactate on Hybridoma Growth, Metabolism, and Antibody Production. Biotechnol. Bioeng. 39(4) 1992: 418–431.
9 Schneider M, Marison IW, von Stockar U. The Importance of Ammonia in Mammalian Cell Culture. J. Biotechnol. 46(3) 1996: 161–185.
10 Patel SD, et al. The Lactate Issue Revisited: Novel Feeding Protocols to Examine Inhibition of Cell Proliferation and Glucose Metabolism in Hematopoietic Cell Cultures. Biotechnol. Progr. 16(5) 2000: 885–892.
11 Fischer K, et al. Inhibitory Effect of Tumor Cell-Derived Lactic Acid on Human T Cells. Blood 109(9) 2007: 3812–3819.
12 Akatov VS, et al. Low pH Value of Pericellular Medium As a Factor Limiting Cell Proliferation in Dense Cultures. Exp. Cell Res. 160(2) 1985: 412–418.
13 Loeffler DA, et al. Analysis of Distribution of Tumor- and Preneoplasia- Infiltrating Lymphocytes Using Simultaneous Hoechst 33342 Labeling and Immunophenotyping. Cytometry 13(2) 1992: 169–174.
14 Carswell KS, Papoutsakis ET. Extracellular pH Affects the Proliferation of Cultured Human T Cells and Their Expression of the Interleukin-2 Receptor. J. Immunother. 23(6) 2000: 669–674.
15 Wang R, Green DR. Metabolic Reprogramming and Metabolic Dependency in T Cells. Immunol. Rev. 249(1) 2012: 14–26.
16 Morgan DA, Ruscetti FW, Gallo R. Selective In Vitro Growth of T Lymphocytes from Normal Human Bone Marrows. Science 193(4257) 1976: 1007–1008.
17 Besser MJ, et al. Modifying Interleukin-2 Concentrations During Culture Improves Function of T Cells for Adoptive Immunotherapy. Cytother. 11(2) 2009: 206–217.
Corresponding author Michelle L. Janas ([email protected]) is a senior scientist, and Claudia Nunes, Angela Marenghi, and Vincent Sauvage are scientists in cell therapy technologies at GE Healthcare, Forest Farm Industrial Estate, Cardiff CF14 7YT, United Kingdom; 44-29-2052-6000. Brian Davis, Anshika Bajaj, and Andrew Burns are scientists at the GE Global Research Center, One Research Circle, Niskayuna, NY 12309; 1-518-387-5000.
You May Also Like
