Oxygen Mass Transfer Correlation for a Rocking-Motion Bioreactor System
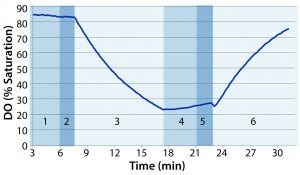
Figure 1: Example of dissolved oxygen (DO) profile over the course of one test: (1) stop rocking and compress to eliminate headspace air; (2) inflate with nitrogen; (3) start rocking; (4) stop rocking and compress to eliminate headspace nitrogen; (5) inflate with air; (6) starting rocking at predetermined test conditions
Disposable bioreactor systems are technologies commonly used in bioprocessing. They provide cost-effective contamination control and allow more flexible facility layouts than do stainless steel alternatives. One of the most popular types of single-use bioreactors uses a rocking platform in place of a traditional shaft and agitator assembly to aerate and mix cell culture material within a presterilized, single-use plastic bag (1). The system studied here is the ReadyToProcess WAVE 25 bioreactor (GE Healthcare Life Sciences).
In contrast to conventional stirred tanks, rocking-motion bioreactor systems do not rely on oxygen spargers for culture aeration or agitators for mixing. Instead, the large surface-to-volume ratio and rocking motion of these bioreactors generate surface aeration that meets the oxygen demands of mammalian cell cultures — often exceeding those delivered by stirred tanks (2). Rocking-motion bioreactor systems also have been shown to improve fluid turnover and minimize shear forces in comparison with stirred tanks (3). Such flow conditions reportedly produce better cell suspension and reduce risk of cell damage and thus have enabled rocking-motion bioreactors to reach higher maximum cell densities than traditional spinner flasks (2). However, relative to the extensively researched stirred-tank, this new technology warrants further characterization.
Previous studies of rocking-motion bioreactors had a narrowly defined focus for the process conditions tested. Often, emphasis was placed on a small range of set points appropriate for culturing a specific type of cell. Furthermore, the different bioreactor system designs studied may explain the oxygen mass transfer coefficient kLa results that cannot be compared adequately.
For example, Singh studied oxygen transfer in a 20-L bag at 50% fill on a system with a rocking capacity of 5–40 rpm and 5–10°, and the maximum kLa observed was 4 h–1 (2).
Mikola et al. examined a WAVE bioreactor with a 10-L bag filled to 50% volume with phosphate-buffered saline (PBS) and UCON antifoam at 30°C (4). When the system rocked at a 10° angle, kLa was linearly dependent on rocking rates up to 25 rpm but increased by a factor of four when the rocking rate was 40 rpm. Westbrook et al. found that with the same bag size and a liquid volume heated to 28 °C kLa was a linear function of rocking rates from 20 to 40 rpm with angle constant at 10° (5). Oxygen mass transfer was a negative linear function of working volume in a 10-L bag filled with 1-, 3-, and 5-L volumes at maximum agitation. The kLa value also was weakly dependent on overlay flow rate.
In a study involving a 50-L WAVE bioreactor with a 20-L working volume, Yuk et al. (6) reported that kLa correlated positively with rocking rate and rocking angle, as supported by the observations of Westbrook et al. (5). Yuk et al. (6) identified rocking rate and angle as the most significant factors affecting kLa. However, it was reported that overlay flow rate had no observable effect.
Previous research has noted general trends of oxygen mass transfer in rocking-motion bioreactors. Mention of specific kLa values, however, often is limited to a narrow range of process conditions that were of interest for culturing a specific cell line. The goal of this study was to complete a wide-ranging survey of kLa in the WAVE 25 system (GE Healthcare Life Sciences) operating at various process conditions, from which quantitative trends in oxygen transfer could be described.
Materials and Methods
We installed the WAVE 25 system according to manufacturer recommendations and secured bags on the trays such that they would not come loose upon inflation. During experiments, a filter heater was clipped to the overlay outlet of the bag. A CBCU gas controller (GE Healthcare) regulated overlay gases. Air and nitrogen shared the same inlet port on the CBCU, so the individual gas lines were disconnected and swapped as needed. Each bag was filled to a different volume with a simulated culture medium composed of 1× PBS and Pluronic F-68 (Dow Chemical Company) at a concentration of 1 g/L.
We connected a dissolved oxygen (DO) sensor to the corresponding optical membrane on the underside of the bag. The DO optical probe was calibrated by entering the calibration constants on the bag label into UNICORN system control software (GE Healthcare Life Sciences) running on the connected computer. The probe was set to the minimum reading cycle of 10 seconds, as indicated by the supplier. To prepare for experimentation, we secured the bag to the rocker and semi-inflated it with air. As the bag continued to inflate, it was filled with a volume of cell-free, simulated culture medium through a separate port and heated it to 37 °C. The rocker was turned on, and the medium was left to equilibrate for at least two hours before testing.

Table 1: Operating set points by bag size
Experiments were conducted using a 50-L bag on Tray 50, a 20-L bag on Tray 20, and a 10-L bag on Tray 10. We conducted a series of tests on each bag size at two different working volumes. Tests with the same angle were performed in succession, and the rocking rates were ordered randomly within each constant angle group. Results from preliminary tests supported the findings of Westbrook et al. and Yuk et al. (5, 6): Overlay flow rate was not a significant factor in determining the value of kLa given the range of flow rates typically used for mammalian cell culture. Thus, overlay flow rate was not considered further and was kept constant at 0.3 standard liters per minute (SLPM) for the remainder of the experiments. Table 1 outlines the operating set points tested on each bag size.
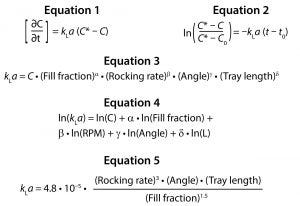
Oxygen is transferred between the liquid and gas phases in response to a difference between liquid saturation concentration and current liquid concentration at a given point in time. The rate at which oxygen transfers between these two phases depends on the magnitude of that concentration difference as well as kLa. Equation 1 describes this relationship, where C is the DO concentration at time t, and C* is the theoretical saturation concentration.
Equations:
Although C and C* can be measured using a DO probe, the value of kLa cannot be measured directly. By integrating Equation 1 from time t0 to t, the value of kLa can be evaluated by determining the slope of a line fitted to the left-hand side (LHS) of Equation 2 over time.
We applied the dynamic “gas-in, gas-out” method with bag compression for kLa determination as previously implemented by Yuk et al. for the study of a rocking-motion bioreactor (6). To facilitate oxygen transfer out of the medium, we opened a port and compressed the bag to force out the headspace air. The bag was reinflated with nitrogen at 3 SLPM while the rocker was stationary. Once the bag was firm, we reduced the nitrogen flow rate and initiated the rocking motion. Under these conditions, the DO content of the medium decreased.
Following deoxygenation, we paused the rocker and compressed the bag again to force out headspace nitrogen. The bag was reinflated with air at 3 SLPM until firm. Finally, we set the overlay flow rate to 0.3 SLPM and started the rocking motion at a specified rate and angle. Figure 1 shows a sample DO profile observed during the course of the test, with the numbered regions distinguishing the different phases of the test.
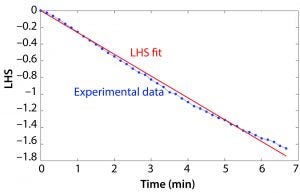
Figure 2: Example of the left-hand side (LHS) of Equation 2 based on an example data set and the resulting slope determining kLa.
DO runtime data were processed in MATLAB software. The value of the LHS of Equation 2 was calculated based on the DO measurement at each time point, and the resulting vector was plotted over time. A constrained least squares model was used to approximate the slope of the LHS versus time plot, and this value was taken as kLa. Figure 2 shows a plot of the LHS of the equation based on the experimental data and the right-hand side of Equation 2 and the resulting kLa.
Results and Discussion
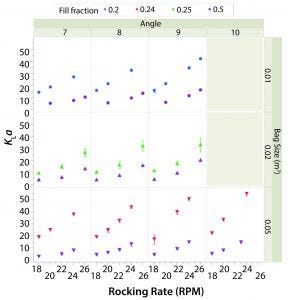
Figure 3: Average kLa and rocking rate by angle (columns) and bag size (rows).
Figure 3 shows the average kLa or each combination of set points (63 in total). The value of kLa with respect to rocking rate is plotted by angle (columns) and bag size (rows). Different working volumes are indicated by marker color and reported in the legend as fill fraction. Error bars represent one standard deviation from the mean.
In general, kLa increased with rocking rate over the range of set points tested in the two bag sizes. This behavior is expected because increasing agitation causes larger waves and thus air entrainment. The effect of angle was less pronounced, although increasing angle did have a sizeable effect on kLa when operating at higher rocking rates. The kLa values for lower working volume were greater than those for higher working volumes given the same rocking rate and angle. The kLa values were relatively similar in the 20-L and 50-L bags when the working volumes in each were 50%.
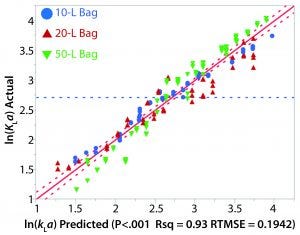
Figure 4: Actual and predicted kLa plot
The relationship between kLa and various process parameters was analyzed using JMP (SAS Institute). A linear-regression statistical model was fitted to all obtained kLa values. The kLa values were assumed to be independent, despite the potential for intrabag correlation between kLa values given that repeated kLa values were calculated from experiments on the same bag. As previously noted, results from the oxygen transfer experiments indicated a strong dependence of kLa on rocking rate as well as a modest dependence on angle. Fill volume also had a significant effect on kLa as greater values were observed for the lower fill in each bag. Figure 4 shows a plot of the actual kLa values versus the model predictions.
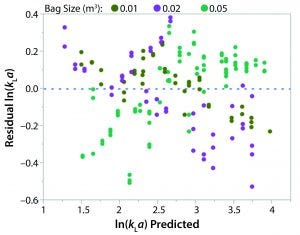
Figure 5: Residual ln(kLa) by predicted ln(kLa) plot
The influence of bag geometry on kLa also was considered. Figure 6 shows relative bag dimensions. It was observed during the experiments that fluid flow occurs predominantly in the length direction because the system is not baffled and rocks only in one dimension. In this way, the width has a lesser role in dictating the physical phenomena that occur in the bag. Therefore, the only dimension taken into account for the kLa model was the length.
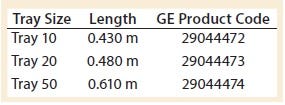
Table 2: WAVE 25 bioreactor length specifications per tray size
However, because the length of the bag decreases after it is filled and inflated, the tray’s length was a better description of the characteristic length affecting wave-action phenomena. Table 2 shows the manufacturer’s specifications for tray length. Note that all experiments conducted in this study used a Tray 10 for the 10-L bag.

Figure 6: Diagram of uninflated bag proportions (not to scale) relative to the axis of rocking shown in red.
The power law expression in Equation 3 was developed to analyze the relationship between kLa and the four relevant parameters: fill fraction, rocking rate, rocking angle, and tray length. The distribution of residuals versus predicted kLa for the above model was curved, so a natural log transformation was used to improve the linearity of the model.
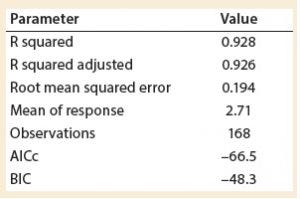
Table 3: Summary of fit
A least squares analysis was used to estimate the constants (C, α, β, γ, δ) in Equation 4. As Table 3 shows, an R2 value of 0.93 was observed between kLa and the selected parameters. The t-values indicate that the relationship between kLa and these parameters is statistically significant (Table 4). Figure 5 shows residuals, and Equation 5 defines the prediction expression, where the response variable is kLa (h–1), and the factors are rocking rate (rpm), angle (°), tray length (m), and fill fraction (dimensionless). Based on that model, rocking rate has the strongest effect on kLa. Changes in angle have a more modest effect. The kLa value is inversely related to fill fraction, consistent with traditional bioreactors.

Table 4: Parameter estimates
Based on the four fundamental parameters, this model can predict kLa with 87% of the cases within 30% accuracy of the measurement in either of the two bag sizes tested. Because kLa is related to tray length, oxygen transfer behavior in a 10-L bag can differ depending on whether it is operated on Tray 10 or Tray 20.
Based on that model, rocking rate has the strongest effect on kLa. Changes in angle have a more modest effect. The kLa value is inversely related to fill fraction, consistent with traditional bioreactors. Based on the four fundamental parameters, this model can predict kLa with 87% of the cases within 30% accuracy of the measurement in either of the two bag sizes tested. Because kLa is related to tray length, oxygen transfer behavior in a 10-L bag can differ depending on whether it is operated on Tray 10 or Tray 20.
Significance of Bag Geometry
Figure 6 shows the axis of rocking in relation to the three bag sizes. Two blue plastic cylinders are built into each bag so that it can be clipped onto the corresponding tray at opposite ends. Each bag size has distinct proportions and thus a distinct physical space where mass transfer occurs.
The 10-L and 20-L bags are similar in length. However, they form noticeably different shapes when inflated. During setup, we observed that the uninflated 20-L bag was taut when properly clipped onto the tray. Thus, when it was inflated, the 20-L did not expand upward very much and remained relatively flat. By contrast, the 10-L and 50-L bags (not pictured) were loose in the middle after being secured to the tray, so they became rounded and balloon-like when inflated.
Consequently, the 20-L bag was narrower at each end where the wave crashes. It is possible that this physical shape directed crashing waves downward upon themselves rather than upward through the headspace, thus altering the mechanism of oxygen entrainment in the 20-L bag with respect to the other two sizes. We believe that this geometric distinction is better captured by the tray length than the bag size, so the tray length parameter was used in the kLa model.
Statistical Model for Rocking-Motion Reactors
Experiments were performed to characterize the oxygen mass transfer behavior of a ReadyToProcess WAVE 25 system. The value of kLa was investigated in response to inputs for rocking rate, rocking angle, working volume, and bag dimensions. It was observed that kLa increased with rocking rate, whereas the relationship between kLa and angle was less pronounced. The value of kLa decreased with greater working volume. Calculated kLa values were used to develop a statistical model for kLa prediction based on four relevant process parameters. A standard least squares analysis was used to identify a correlation (R2 = 0.93) between the calculated kLa values and the set points for fill fraction, rocking rate, rocking angle, and tray length.
The statistical model suggests that kLa is negatively correlated with fill fraction and positively correlated with rocking rate, angle, and tray length. With the increasing popularity of disposable rocking-type bioreactor systems, this model offers a useful tool for translation of traditional cell-expansion processes into this new technology by providing an estimate of kLa given different combinations of set points. The results also have shown that when operating at 50% of a bag’s volume, the mass transfer is approximately the same regardless of bag size. This simplifies seed train expansion because a larger bag, if used at a 50% fill volume, would operate with a similar kLa as the previous step.
References
1 Levine HL, et al. Efficient, Flexible Facilities for the 21st Century. Bioprocess Intl. 10(11) 2012: 20–30.
2 Singh V. Disposable Bioreactor for Cell Culture Using Wave-Induced Agitation. Cytotechnol. 30(1–3) 1999: 149–158.
3 Öncül AA, et al. Characterization of Flow Conditions in 2 L and 20 L Wave Bioreactors Using Computational Fluid Dynamics. Biotechnol Prog. 26(1) 2010: 101–110; doi:10.1002/btpr.312.
4 Mikola M, Seto J, Amanullah A. Evaluation of a Novel Wave Bioreactor Cellbag for Aerobic Yeast Cultivation. Bioprocess Biosyst. Eng. 30(4) 2007: 231–241; doi:10.1007/s00449-007-0119-y.
5 Westbrook A, et al. Application of a Two-Dimensional Disposable Rocking Bioreactor to Bacterial Cultivation for Recombinant Protein Production. Biochem. Eng. J. 88, 2014: 154–161.
6 Yuk IH, et al. Overcoming Challenges in Wave Bioreactors Without Feedback Controls for pH and Dissolved Oxygen. Biotechnol. Prog. 27(5) 2011: 1397–1406; doi: 10.1002/btpr.659.
Erin Shaughnessey was a co-op student during this work. Corresponding author Armin Opitz is principal process engineer, and Jack Prior is senior director at the Manufacturing Science group in Global Manufacturing Science and Technology, Sanofi, 1 Research Drive, Westborough, MA 01581; [email protected].
Conflict of Interest
The research presented in this manuscript is original and has not been submitted previously or concurrently for publication in any other journal. The authors have no conflicts of interest to declare.
You May Also Like


