Characterizing Oxygen Mass Transfer and Shear During Cell Culture: Calculating the Maximum Cell Density Supported By a 20,000-Liter Stirred-Tank Bioreactor
Increasing demand for biologics and continuing limitations with single-use bioreactors (up to 5,000 L) compel some biopharmaceutical manufacturers to transfer their production processes into large-scale (20,000-L) stainless-steel bioreactors. Over decades of advancement, the industry has developed high–cell-density (HCD) cell-culture processes.
When transferring an HCD cell culture from 2,000-L to 20,000-L production bioreactors, process engineers first must assess whether the larger bioreactors can meet the high oxygen demands required for high-density cultures. If so, the next consideration is whether the process requires aggressive impeller-agitation and gas-flow rates for oxygenation, both of which can generate high levels of shear. Using aggressive impeller and gas-flow strategies will compel engineers to explore scale-up methodologies to minimize adverse impacts from excessive shear on cell growth and productivity.
During cell-culture operations, oxygen is a key rate-limiting factor for cell growth and protein production. Cells consume dissolved oxygen (DO) in liquid media. Thus, the primary function of a bioreactor is to support cell respiration by maintaining needed DO concentrations, which can be accomplished through sparging and impeller agitation. Impeller agitation disperses sparged gas bubbles and promotes mass transfer of those bubbles through the gas–liquid (medium) interface.
The rate of oxygen transfer (OTR) from gas to liquid in a cell culture is a function of growth-medium properties and bioreactor design and operating parameters (1, 2). Herein, we present a study on OTR performed using a 20,000-L stirred-tank bioreactor (STBR). We discuss how data from such studies can be used to assess the maximum cell density that a given bioreactor can support. In addition, we elucidate a shear-proof design space for our bioreactor’s operating conditions.
Methods for Studying Oxygen Mass Transfer
Pseudomedium Preparation and Mass-Transfer Measurement: The volumetric oxygen-transfer coefficient (kLa) serves as a quantifiable measure of how efficiently oxygen is transferred from a gas phase to a liquid medium. The variable kL is the mass-transfer coefficient (m/h), and a is the interface area available for mass transfer per unit volume of liquid. Because the dynamics of sparged gas bubbles vary continuously inside a bioreactor, measuring kL independently from a and vice versa is difficult. Thus, those terms are measured together and reported as kLa in units of (1/h) (3). Bioreactor operating parameters that influence kLa include operating volume, impeller-agitation rate, and gas-flow rate through a sparger and overlay (4–6).

Equations 1–3: Effect of culture-medium components on volumetric oxygen masstransfer coefficient.
Effect of Surfactant Concentration on kLa: Pluronic F-68 poloxamer 188 surfactant (from BASF) is among the most frequently used shear-protecting agents in cell-culture medium formulation. Such agents reduce surface tension at the gas–liquid (medium) interface. However, the resulting drop in liquid surface tension follows an exponential decay curve that plateaus after 1 g/L (Figure 1A).
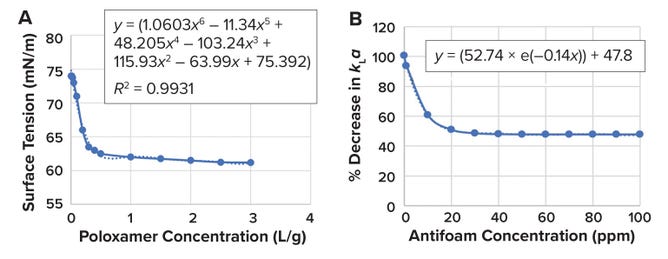
Figure 1: (A) Effect of poloxamer 188 concentration on culture-medium surface tension; (B) effect of antifoam-agent concentration on bioreactor volumetric oxygen-transfer coefficient (kLa).
Therefore, most commercially available, off-the-shelf cell-culture media are formulated to a poloxamer concentration of 1 g/L. Higher concentrations have little effect on liquid surface tension to protect cells from shear (8). Sieblist et al. report a small-to-negligible impact on kLa for poloxamer 188 concentrations of 0.1–1.0 g/L (9). Because bubble appearance and size depend strongly on sparger type, the team notes that their experiments involved drilled-hole spargers. Given such information in available literature, we did not include surfactant when preparing our pseudomedium.
Effect of Salinity on kLa: The solubility of DO decreases as salinity increases. Osmolality is a surrogate measurement of salinity. Most cell-culture growth media are formulated to an osmolality of 290–320 mOsmol/kg (4). We prepared a pseudomedium using a simple NaCl solution to mimic the osmolality of cell-culture medium. When NaCl dissolves in water, it completely dissociates into Na+ and Cl–. Thus, for every mole of NaCl per liter of medium, the osmolality increases by 2 Osmol/L (7). The amount of NaCl in our pseudomedium is calculated as 9 g/L (Equation 1).
Effect of Antifoam Concentration on kLa: Routledge reports that addition of an antifoam agent — e.g., simethicone — increases bubble coalescence in cell-culture medium, leading to a reduced mass-transfer area and thereby reducing the kLa value (10). McAndrew and Kauffman provide an empirically derived equation that predicts the effects of antifoam concentration on kLa values (11). When evaluating simethicone concentrations of 1 ppm to 100 ppm with antifoam C emulsion solution in a drilled-hole–sparger bioreactor system, the writers observed a decrease of up to 50% in kLa values beyond concentrations of 30 ppm (Figure 1B). (Equation 2 provides the expression for the percentage reduction in kLa according to the antifoam concentration.) Figure 1B shows that the reduction in kLa follows an exponential decay curve that plateaus for antifoam concentrations exceeding 30 ppm. Because the amount of antifoam used in cell-culture processes usually ranges from 0 to 30 ppm, and because the effect of antifoam concentration on kLa is predictable, we did not include such surfactant when preparing our pseudomedium.
Changes in Bioreactor-Fluid Density and Viscosity: Several factors influence the magnitude and rate of change in culture-medium viscosity and density. They include viable-cell density (VCD), culture duration, supplement concentrations in a formulated growth medium, feed additions, cell-metabolism rates, and base-titrant consumption rates. During culture, cells produce proteins, debris, metabolites, and growth factors, all of which increase the surrounding fluid density and viscosity. At the same time, cells also consume proteins, glucose, nutrients, and growth factors, reducing fluid density and viscosity (12). In fed-batch mammalian-cell culture, fluid viscosity can range from 0.85 to 1.05 mPa.s, and the density can range from 1,007 kg/m3 to 1,015 kg/m3 over a transition from a cell-free medium to a spent HCD-harvest medium (12, 13).
Effect of Fluid Density and Viscosity on kLa: Equation 3 represents Higbie’s penetration theory for gas diffusion from gas bubbles rising in liquid (14). Here, DL represents the diffusion constant for oxygen, єL is the dissipation rate of turbulent kinetic energy per unit mass, µ denotes the liquid viscosity, and ρ is the liquid dynamic density. Equation 3 shows a proportional relationship between liquid density and the mass transfer coefficient (kL) and an inverse relationship between liquid viscosity and kL.
In accord with Higbie’s penetration theory, Xu et al. and Solecki report that increasing viscosity results in a reduced kLa value (15, 16). Moreover, Koide et al. and Yoshida et al. write that an increase in liquid density results in a kLa increase (17, 18).
Magnitude of Change in Density and Viscosity During Cell Culture and Its Effect on kLa: Pappenreiter et al. observe no significant changes in kLa between cell-free media and spent harvest media from a Chinese hamster ovary (CHO) fed-batch culture (19). Therefore, changes in viscosity are considered to have a minimal overall impact on such values. Hence, we did not implement changes in viscosity and density for our kLa predictive-model study.
Measurement Method: Linek et al. propose a method for accurate measurement of kLa in a large-scale bioreactor, a concept that they call the “dynamic pressure method” (DPM) (20). In the DPM, when the measured DO value is stabilized for specific bioreactor operating parameters (such as culture volume, impeller agitation rate, sparger gas-flow rate, and pressure), then total pressure increases by 20%.
According to Henry’s law, an increase in bioreactor pressure will lead to a simultaneous change in the oxygen concentration of all bubbles that are dispersed in the liquid, thereby reducing the influence of nonideal mixing of the gas phase on the kLa measurement. Upon initiation of a step-change increase in bioreactor pressure, the %DO value increases and reaches a new saturation value (Figure 2A). As shown in Figure 2B, plotting the expression ln[(C* – C) ÷ (C* – C0)] as a function of time yields a slope of (–kLa). For the equations in those figures, t is the time in seconds, C* is the saturation concentration of oxygen (expressed as a percentage), CO is the concentration of oxygen (as a percentage) at initial pressure change, and C is the oxygen concentration at any time (as a percentage) (5, 20).

Figure 2: Calculating a bioreactor’s volumetric oxygen-transfer coefficient (kLa); panel (A) depicts dissolved oxygen (DO) levels, with C referring to a concentration at a given time (t), C0 as the DO concentration upon initial pressure increase, and C* as the saturation concentration; panel (B) plots results from application of the “dynamic pressure model” (DPM) to obtain –kLa values (20).
Predictive kLa Modeling
Bioreactor Power: We applied a partial-factorial design form as the design of experiment (DoE) to characterize kLa and develop a predictive response-surface model. For kLa characterization, we selected the following inputs:
• impeller agitation rate — at 20, 30, and 40 revolutions per minute (rpm)
• sparger air-flow rate — at 250, 450, and 900 liters per minute (lpm)
• vessel working volume — at 10,000 L and 16,800 L.
We studied eight conditions with different combinations of volume, impeller agitation rate, and sparger gas flow rate (Figure 3). For each condition, we measured and calculated a kLa value using the DPM. Applying a standard least-square regression model (using JMP 16.0 software) enabled development of a predictive model, which is shown in Figure 4A.
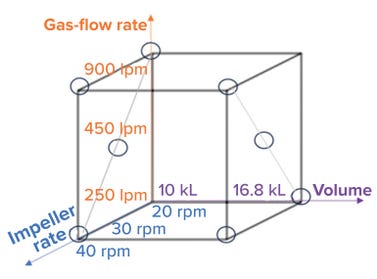
Figure 3: Parameters for kLa assessment (lpm = liters per minute, rpm = revolutions per minute, and kL = kiloliters).
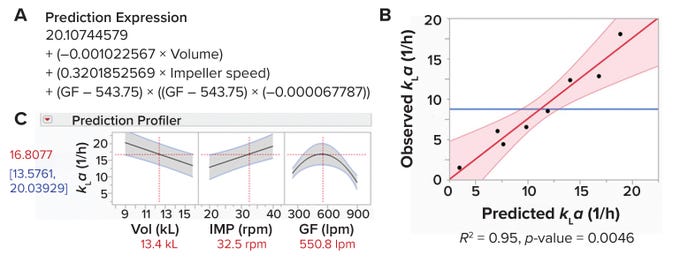
Figure 4: Predictive model for measuring a bioreactor’s volumetric oxygen-transfer coefficient (kLa).
Figure 4B displays observed and predicted values. R2 is a statistical measure of how well a predictive expression fits observed data. The obtained value of R2 = 0.95 demonstrates the reliability of our predictive expression. Moreover, we obtained a p-value (0.0046) <0.05, demonstrating that the strength of association between the input and output variables is statistically significant.
Figure 4C depicts a prediction profiler for the magnitude of change in the response variable (kLa) that occurs when one input parameter is changed while all others are held constant. As expected, Figure 4C shows increases in kLa and impeller-agitation rates with a decrease in working volume. Of interest is that our data show an increase in kLa with increasing gas-flow rate up to 550 lpm; however, kLa starts decreasing at higher flow rates. That result could be explained as an impeller flooding regime. At a certain combination of low impeller agitation speed and high gas-flow rate, bubbles are not dispersed across the liquid by impeller agitation and simply escape out of the liquid (6).
Calculating Maximum Cell Densities Using kLa Values
Measuring Oxygen Mass Transfer: OTR measures how much oxygen can be transferred in a bioreactor per unit of time for a specific kLa value at a specified fraction of oxygen in the gas phase. That rate can be calculated using Equations 4–6 and kLa values (1/h) determined by the predictive-model expression shown in Figure 4A.
As noted above, C* is the saturation concentration of oxygen in mmol/L, as calculated from Equation 4. The variable H denotes Henry’s coefficient for oxygen solubility in water. For typical culture operating conditions at 37 °C, H = 1.07 mmol/(L.atm) is a good approximation.

Equations 4–6: Oxygen transfer rate (OTR).
The average bioreactor pressure (in atmospheres) is denoted as P. In a bioreactor, positive pressure is maintained; pressure in the headspace and from the liquid height sum up to be >1 atm. However, for simplicity in our calculation, we assume that P = 1 atm.
The variable foxy represents the fraction of oxygen in the incoming gas. The fraction of oxygen in air is 0.21 (21%); however, to assess the maximum capability of our bioreactor, we assume here that it is sparged with pure oxygen (foxy = 1). The variable CL is the setpoint oxygen concentration maintained in the bioreactor (expressed in mmol/L), as calculated from Equation 6. DO probes are calibrated to 100% through exposure to atmospheric oxygen concentrations. Therefore, a 50% DO setpoint indicates 50% of 21%.
Measuring Oxygen Uptake: Oxygen is crucial to cell metabolism. The primary metric for bioreactor capability is the system’s ability to meet cells’ oxygen-respiration rate — the oxygen uptake rate (OUR). As shown in Equation 7, the OUR is the product of the VCD value and the specific oxygen-consumption rate of cells in a bioreactor (QO2) (4). The latter variable is defined as the amount of oxygen consumed per cell per unit time (pmol/(cell.day)). The variable Xi represents the VCD (106 cells/mL).

Equations 7–8: Oxygen transfer rate (OTR), oxygen uptake rate (OUR), and maximum cell density; QO2 = specific oxygen-consumption rate for cells in a bioreactor, kLa = volumetric oxygen-transfer coefficient.
Specific OUR (QO2) Values Differ Across Mammalian Cell Lines: For mammalian cells, QO2 values are cell-line specific. Jorjani et al. report maximum QO2 values for baby hamster kidney (BHK), murine hybridoma, and CHO cells that are cultured at 37 °C as 7.2, 5.28, and 7.44 pmol/cell.day, respectively (21).
Effect of Temperature on QO2 Values for Mammalian Cells: During cell-culture processes, operators often shift temperature from 37 °C to 29–35 °C to increase productivity and maintain product quality. Such a downward temperature shift has been shown to improve cell viability and specific productivity (22, 23). All biological and chemical reactions are temperature dependent and can be modeled by the Arrhenius equation (see Figure 5). There, A is the Arrhenius constant, and E represents the activation energy (kJ/mol). R is the ideal-gas constant (0.00831 kJ/mol.K), and T is the temperature in kelvins. Figure 5 models the change in QO2 as a function of temperature for BHK, hybridoma, and CHO cell lines using A and E values reported by Jorjani et al. (21).
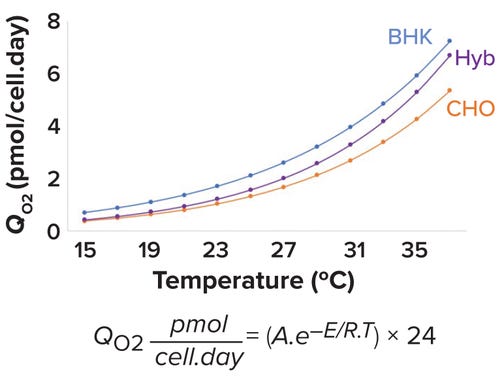
Figure 5: Specific oxygen-uptake rate (QO2) as a function of temperature for baby hamster kidney (BHK, blue), murine hybridoma (Hyb, purple), and Chinese hamster ovary (CHO, orange) cell lines.
Dynamic Change in Bioreactor QO2 Values: The change in cell density per unit of time is defined as the growth rate (cells/h); the change in cell density per cell per unit of time is defined as the specific cell-growth rate (cells/(cell.h)) or (1/h). In protein-biologics manufacturing, bioreactors often are operated in fed-batch mode. As cells proliferate during culture, the medium composition changes constantly, diminishing nutrient levels and accumulating toxic metabolites. That situation changes the cells’ physiological state and thus reduces the specific cell growth rate.
Table 1: Values for calculation of specific oxygen-uptake rate (QO2) in Figure 5 for baby hamster kidney (BHK), murine hybridoma, and Chinese hamster ovary (CHO) cell lines; A = Arrhenius constant, E = activation energy, and R = gas constant.
The VCD profile of a culture in batch or fed-batch mode includes phases for exponential cell growth, stationary growth, and decline. Cell growth rates begin high (during the exponential phase) and plateau as cells enter the stationary phase. Growth rates fall as cells enter the declining phase. Note that the specific cell growth rate represents cells’ physiological state (and thus their ability to proliferate) rather than their growth rate as such. In fed-batch cell cultures, analysts typically observe both a decrease in the specific cell-growth rate and an increase in the rate of cells produced.
Effect of Culture Time on Cell-Specific OUR: Ihling et al. report that the specific OUR of a CHO-cell culture decreased from 5.7 to 2.4 pmol/cell.day at 96 hours after inoculation (24). Deshpande et al. similarly observe a specific OUR decrease from 7.7 to 4.8 pmol/cell.day as early as 50 hours after inoculation (25).
Effect of Specific Growth Rate on Cell-Specific OUR: As cells proliferate, they require more oxygen for respiration. Thus, specific OURs are directly proportional to specific growth rates (3). Using data reported by Deshpande et al. (25), we developed an exponential correlation expression between the cell specific growth rate and specific OUR (Figure 6A) (Equation 10).

Figure 6: Comparing specific oxygen consumption rate (QO2) with specific growth rate and viable-cell density (VCD).
Effect of Cell Density on Cell-Specific OUR: As VCD increases during culture, so do metabolite concentrations because of cell metabolism and feed additions. Those increases reduce specific OURs. Sand et al. identify that phenomenon as a “metabolic-crowding effect” in mammalian suspension cell culture (26). As shown in Figure 6A, we developed a logarithmic correlation expression between VCD and specific OUR based on data from Wohlpart et al. (27) and Deshpande et al. (25). For a typical mammalian-cell culture in a fed-batch bioreactor operation with a cell density of 0.5–50 × 106 cells/mL, the specific oxygen consumption rate ranges from 6.0 to 3.5 mmol/cell (Figure 6B).
For the purpose of illustration, we assume a specific growth rate ranging from 0.03 to 0.001 (1/h) and a seeding density of 0.5 × 10⁶ cells/mL (28), and using Equations 9 and 10, we simulated a VCD profile and corresponding cell-specific OUR (Figure 7). The results show that QO2 = 5.5 pmol/(cell.day) is a good approximation of conditions during typical mammalian-culture bioreactor operation. That expression can be applied for conservative calculation of maximum VCD when assessing bioreactor capability (1 pmol = 10–12 mol) (29, 30) (Figure 8).

Equations 9–10: Dynamic change in specific oxygen uptake rate.
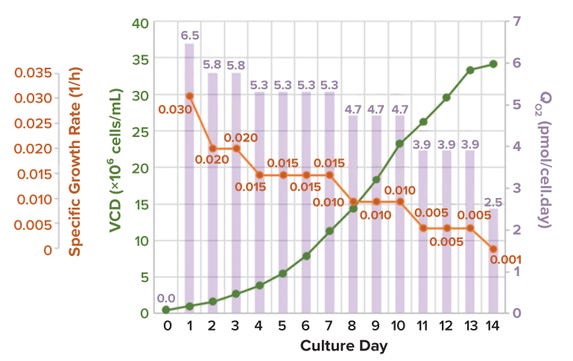
Figure 7: Typical values for cell growth rate, specific cell growth rate, and specific oxygen consumption rate (QO2); data provided by AGC Biologics.
During cell-culture operations, bioreactor OTR should equal bioreactor OUR. By setting Equations 4 and 7 as equal, we can calculate the maximum cell count that can be supported for a given kLa value. Equation 8 indicates that ~4 × 10⁶ cells/mL can be supported for a kLa value of 1 (1/h) when pure oxygen is used as the sparge gas.
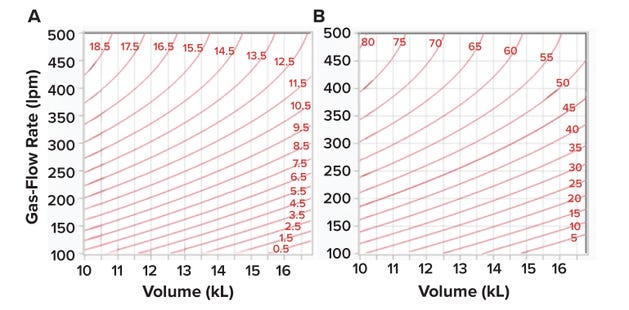
Figure 8: (A) Contour profile showing kLa values (1/h) obtained using the prediction expression in Figure 4A; values were determined as a function of volume (calculated in liters, listed below in kiloliters) and gas-flow rate (in liters per minute, lpm) for an impelleragitation rate of 30 rpm. Panel (B) presents a contour profile of the maximum viable-cell density (VCD, 10⁶ cells/mL) predicted by Equation 9 for each kLa value in Figure 8A.
Assessing Bioreactor Mixing Time
The impeller discharge rate (m3/s) is the volume pumped from an impeller blade per unit of time. Analysts can calculate that rate using Equation 11, in which NF represents the impeller flow number, n is the impeller agitation rate (in rpm), and di signifies the impeller diameter (in meters). Circulation time is defined as the ratio of liquid volume (in m3) to impeller discharge rate (in m3/s) (Equation 12). Bioreactor mixing time refers to the time required to combine completely segregated culture materials to a given level of homogeneity. After several circulations, a desired homogeneity is reached (2). Doran reports that the mixing time for a STBR with several baffles and a small impeller-to-tank-diameter ratio is about four times the circulation time (2) (Equation 13).

Equations 11–13: Impeller mixing time.
In our 20,000-L bioreactor, the agitation system includes two Lightnin A320 impellers (SPX Flow) with an NF value of 0.62. Figure 9A plots mixing times for different impeller-agitation values. As shown there, we calculated that mixing time would not improve significantly with agitation rates beyond 30 rpm.

Figure 9: (A) Comparing mixing time (s) with impeller-agitation rate (rpm); (B) plotting tip speed (m/s) and power:volume ratios (P/V, in W/m³) versus impeller-agitation rate.
Assessing Shear and Impeller-Agitation Rates
Once we established a kLa predictive model, our next step was to identify limitations on impeller-agitation rates. The most frequently used parameters for scaling up impeller-agitation rates are the power-to-volume ratio (P/V, expressed in W/m3) and impeller-tip speed (in m/s).
Power indicates energy consumed over time. Thus, P/V represents the average power consumed by an impeller divided by a bioreactor’s entire volume. The P/V approach helps process engineers not only to scale impeller speeds for different sizes of a given impeller design, but also to scale between different impeller designs and geometries; impeller-power calculations accommodate design differences in impeller configurations (31–33). Commercial-scale bioreactors typically operate at P/V values of <50 W/m3 to minimize deleterious effects on cell health (35). Equation 14 lists the calculation for P/V. There, Np represents the impeller power number provided by the manufacturer, and ρ is the culture-medium density, for which 1,015 kg/m3 is a good approximation (12).

Equations 14–15: Shear according to impeller-agitation rate.
Although average P/V is used across the biopharmaceutical industry as a parameter for determining impeller speeds for a range of STBR scales, the metric does not account for scale-dependent shear heterogeneity, which often occurs inside bioreactors and is especially prevalent in large-scale STBRs. Hu, Berdugo, and Chalmers observe that 70.5% of the total power consumed by a pitched-blade impeller dissipates in the liquid volume near the impeller zone (36). Shear rate is the change in fluid velocity over a given distance. In impeller-based STBRs, impeller-tip speed serves as a surrogate measurement for the maximum shear level inside the reactor because the maximum fluid velocity is observed at the tip of the impeller blade as it revolves in the fluid (33).
For a P/V value maintained across different sizes of bioreactors, impeller-tip velocity rises with increases in bioreactor scale (4). Hence, tip velocity is deemed to be a critical parameter needing evaluation when scaling impeller speed. Such assessments consider only the impeller diameter and agitation speed, not the impeller design.
Impeller-tip speed is calculated using Equation 15. For typical cell-culture processes, process engineers recommend maintaining an impeller-tip velocity of 0.6–1.8 m/s to prevent adverse effects on cell growth (37). Figure 9B plots the impeller-tip speed and P/V at different agitation rates for an STBR with an operating volume of 16,800 L. We observe a limitation in the impeller agitation rate at 30 rpm for a maximum acceptable impeller-tip velocity of 1.8 m/s and at 40 rpm based on the maximum acceptable P/V limit of 50 W/m3. Therefore, we conservatively set 30 rpm as the impeller rate based on a maximum tip speed of 1.8 m/s.
Assessing Shear and Gas-Flow Rate
Key Parameters: Process engineers often assess the average amount of shear in an STBR using the energy-dissipation rate (EDR) for sparged reactors, as reported by Bhavaraju, Russell, and Blanch (38). The average EDR is calculated from Equation 16, in which Qg is the gas-flow rate (in m3/s), dT is the bioreactor-tank diameter, g is the acceleration rate (9.8 m/s2), hT is the bioreactor liquid height (in meters), and P1 and P2 represent the pressures on the surface of the bioreactor liquid and at the sparging point, respectively (in kg.m−1.s−2 or pascals). Based on values from 24 studies of shear assessment, Hu, Berdugo, and Chalmers report an EDR of 104 W/m3 as sublethal for most mammalian cells (36).
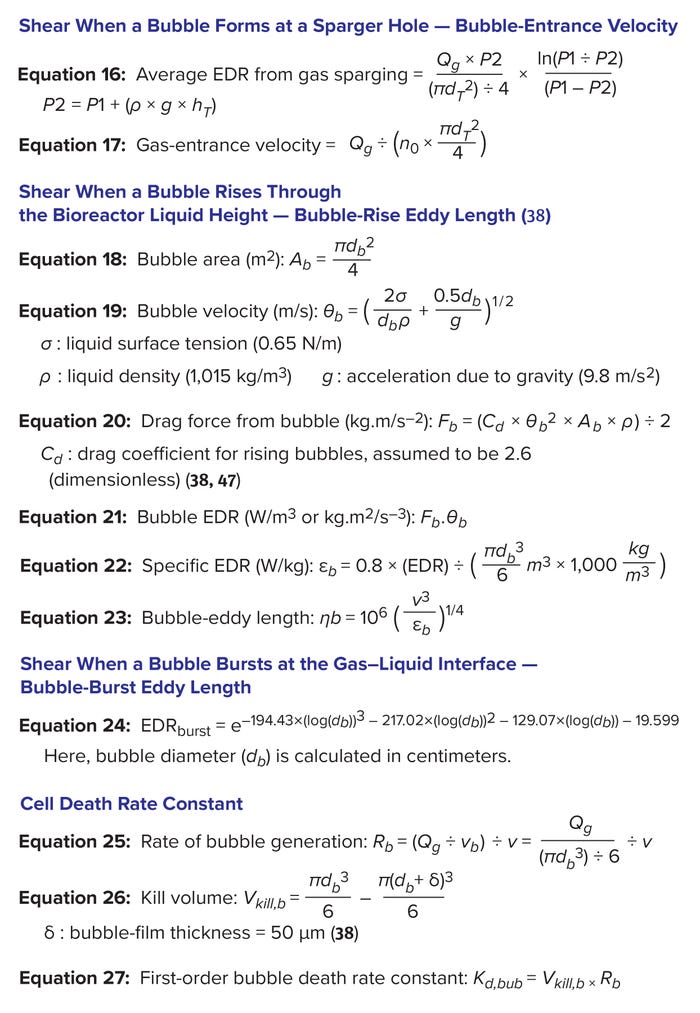
Equations 16–27: Shear from sparging gas.
Another parameter that is assessed frequently when scaling cell-culture gas-flow rates is the gas volumetric rate per bioreactor unit volume, expressed as the volume of air per unit volume of liquid per minute (vvm). That parameter influences shear levels differently across bioreactor scales, and holding it constant does not account for differences in sparger configurations and designs, which often are distinctive to bioreactor models and manufacturers (Figure 10). Chisti reports a decrease in specific cell-growth rate at gas-flow rates >0.04 vvm (39).
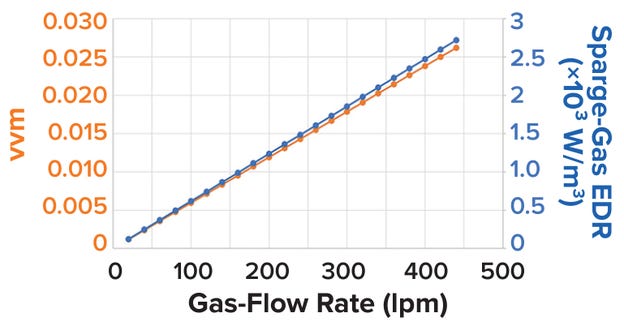
Figure 10: Volume of liquid per minute (vvm) and sparge-gas energy dissipation rate (EDR, in W/m³) plotted against gassparge flow rate (in liters per minute, lpm).
Other parameters for scaling bioreactor gas-flow rates in STBRs include superficial gas velocity, which is a ratio of the volumetric gas-flow rate to a bioreactor’s crosssectional area. Because the calculation for that parameter is part of the average EDR equation for gas sparging (Equation 16), superficial gas velocity needs no further discussion for our purposes.
Bubble Assessment: Localized shear introduced by sparging gas into an STBR is assessed at three phases: when a sparger hole generates a gas bubble, when that bubble rises upward across the liquid height in a bioreactor, and when the bubble reaches the surface and bursts at the gas–liquid surface interface (39) (Figure 11A). When bubbles are generated, shear can be assessed based on gas-entrance velocity (GEV) at the sparger orifice (Figure 11B). GEV is calculated as a ratio of the volumetric gas-flow rate to the total area available for gas to exit (Equation 17). In that calculation, Qg denotes the gas-flow rate (in L/s), do signifies the diameter of a single sparger hole (in meters), and no is the number of holes in the sparger. Zhu et al. (40) and Chaudhary et al. (41) identify >30 m/s and >60 m/s as critical GEV values for preventing adverse effects on cell growth and productivity in nonsecreting murine myeloma (NS0) and CHO cells, respectively. Figure 12a shows that the critical GEV of 60 m/s for CHO cells is reached at a sparge gas-flow rate of 200 lpm.
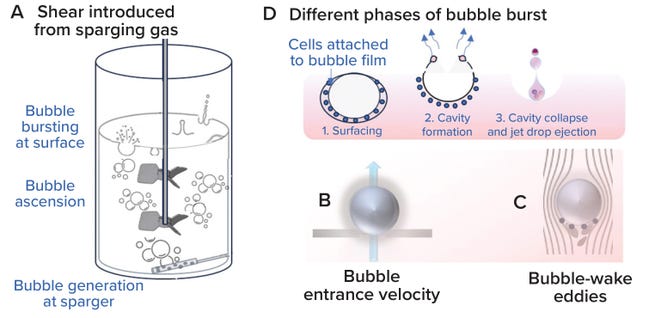
Figure 11: Localized shear from gas sparging (adapted from reference 34).
When evaluating bubbles rising along the bioreactor liquid height, shear levels are based on bubble-wake microeddy length. As bubbles rise through a bioreactor, the circulating fluid carried behind them experiences the greatest drag force (Figure 11C). Bubble-wake eddy length can be calculated from Equations 18–23 (39). A microeddy length that is less than or equal to the diameter of cultured cells is detrimental to cell viability. Hence, that length should be maintained at >20 μm for most mammalian cell-culture operations (4, 39). Figure 12B shows that, for sparge gas-flow rates up to 450 lpm, the bubble wake eddy length is >34 µm.
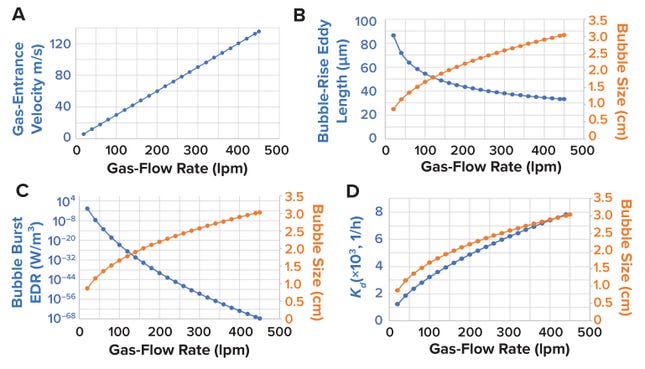
Figure 12: (A) Gas-entrance velocity (GEV, m/s) plotted against gas-flow rate (lpm); (B) bubble diameter (cm) and bubble-rise eddy length (μm) against gas-flow rate (lpm); (C) bubble diameter (cm) and bubble-burst energy dissipation rate (EDR, W/m³) at the gas–liquid interface, compared with gas-flow rate; and (D) bubble diameter (cm) and sparging cell-death–rate constant (1/h) plotted against gas-flow rate.
As a bubble rises, cells become trapped in the film around it. A cavity forms on the bubble surface as it reaches the gas–liquid interface, and as the bubble bursts and the cavity collapses, the resulting liquid jet shears the cells carried in the bubble-film volume (Figure 11D). Shear from bubble bursting is assessed by calculating the EDR at the burst location as a function of bubble diameter (Equation 24). We derived Equation 24 from data presented by Boulton-Stone and Blake (42). That information was obtained using a nonlinear exponential model with JMP 16.0 software (36, 42–44). Walls et al. observe that CHO cells die when exposed to EDR levels >106–108 W/m3 (44). Hu, Berdugo, and Chalmers report that EDR levels of ~104 W/m3 are sublethal for most cell-culture operations (36). Figure 12c shows that the bubble-burst EDR is <104 W/m3 across the entire range of applied gas-flow rates (20–450 lpm).
The above method for calculating bubble-burst EDR depends on the bubble diameter only; however, the technique does not account for the total amount of bubbles generated in a culture or the rate of bubble generation. Tramper et al. present a first-order calculation for the cell-specific death rate constant (Kd) as a function of bubble size, rate of bubble generation per unit volume of culture, and bubble film volume or kill volume (45). The latter parameter is the volume of media over which cells are carried before experiencing shear as a bubble bursts at the gas–liquid interface (26). The death rate constant can be calculated from Equations 25–27. For shear-proof control conditions, Tramper et al. (45) and Chisti (39) demonstrate that the death rate constant is ~0.032 (1/h). Thus, a gas-sparger design yielding a Kd value of <0.032 (1/h) helps to ensure shear-proof conditions for the cells. Figure 12D shows that, for sparge gas-flow rates up to 450 lpm, the bubble-burst EDR is <104 W/m3, while kd is <0.032 (1/h).
Determining Maximum Cell Density in an STBR
The presented assessment for determining the maximum cell density that can be supported for a given kLa value assumes 5.5 mmol/(cell.day). That value is appropriate for most fed-batch mammalian-cell cultures. However, Goudar et al. note that some clones of CHO cells have cell-specific OURs of <10 pg/(cell.day) (30). Process engineers and upstream-production scientists should evaluate the assumed specific OUR carefully in such cases. For shear assessment, the maximum tip speed, GEV, and bubble-burst EDR represent the region of a shear-proof design space based on previously reported studies. That region does not necessarily indicate the edge of failure; therefore, if necessary, a marginal increase in any of the above shear assessments could be explored with an appropriate scale-down model or detailed risk assessment.
References
1 Shuler ML, Kargi F, DeLisa M. Bioprocess Engineering: Basic Concepts. Prentice Hall: Hoboken, NJ, 2017.
2 Doran PM. Bioprocess Engineering Principles. Academic Press: Cambridge, MA, 2013.
3 Stanbury PF, Whitaker A, Hall SJ. Principles of Fermentation Technology (third edition). Butterworth Heinemann: Oxford, UK, 2016; https://www.sciencedirect.com/book/9780080999531/principles-of-fermentation-technology.
4 Hu W-S. Cell Culture Bioprocess Engineering (2nd edition). CRC Press: Boca Raton, FL, 2020.
5 Clark DS, Blanch HW. Biochemical Engineering (2nd edition). CRC Press: Boca Raton, FL, 1996.
6 Benz GT. Agitator Design for Gas-Liquid Fermenters and Bioreactors. John Wiley & Sons: Hoboken, NJ, 2021.
7 Rasouli M. Basic Concepts and Practical Equations on Osmolality: Biochemical Approach. Clin. Biochem. 49(12) 2016: 936–941; https://doi.org/10.1016/j.clinbiochem.2016.06.001.
8 Tharmalingam T, Goudar CT. Evaluating the Impact of High Pluronic F68 Concentrations on Antibody Producing CHO Cell Lines. Biotechnol. Bioeng. 112(4) 2015: 832–837; https://doi.org/10.1002/bit.25491.
9 Sieblist C, Jenzsch M, Pohlscheidt M. Influence of Pluronic F68 on Oxygen Mass Transfer. Biotechnol. Prog. 29(5) 2013: 1278–1288; https://doi.org/10.1002/btpr.1770.
10 Routledge SJ. Beyond De-Foaming: The Effects of Antifoams on Bioprocess Productivity. Computat. Structur. Biotechnol. J. 3(4) 2012: 201210014; https://doi.org/10.5936/csbj.201210014.
11 McAndrew J, Kauffman G. Characterizing the Effects of Antifoam C Emulsion on Oxygen Mass Transfer within the BIOne Drilled-Hole Sparger and Microsparger Single-Use Bioreactor Systems. Amer. Pharm. Rev. 6 April 2021; https://www.americanpharmaceuticalreview.com/Featured-Articles/575447-Characterizing-the-Effects-of-Antifoam-C-Emulsion-on-Oxygen-Mass-Transfer-within-the-BIOne-Drilled-Hole-Sparger-and-Microsparger-Single-Use-Bioreactor-Systems.
12 Poon C. Measuring the Density and Viscosity of Culture Media for Optimized Computational Fluid Dynamics Analysis of In Vitro Devices. J. Mech. Behav. Biomed. Mater. 126, 2021: 105024; https://doi.org/10.1101/2020.08.25.266221.
13 Pham CY, Thömmes J. Patent No. 20050O37333A1. Use of Depth Filtration in Series Related with Continuous Centrifugation To Clarify Mammalian Cell Cultures. US Patent Office: Washington, DC, 17 February 2005; https://patentimages.storage.googleapis.com/ed/88/30/64d8ed92c98458/US20050037333A1.pdf.
14 Werner S, et al. Computational Fluid Dynamics as a Modern Tool for Engineering Characterization of Bioreactors. Pharm. Bioprocess. 2(1) 2014: 85–99; https://doi.org/10.4155/pbp.13.60.
15 Xu Z, et al. Direct Effect ofSolvent Viscosity on the Physical Mass Transfer for Wavy Film Flow in a Packed Column. Indust. Eng. Chem. Res. 58(37) 2019: 17524–17539; https://doi.org/10.1021/acs.iecr.9b01226.
16 Mass Transfer: Advancement in Process Modelling. Solecki M, Ed. IntechOpen: London, UK, 2015; https://www.intechopen.com/books/4690.
17 Koide K, et al. Gas Holdup and Volumetric Liquid-Phase Mass Transfer Coefficient in Solid-Suspended Bubble Columns. J. Chem. Eng. Jap. 17(5) 1984: 459–466; https://doi.org/10.1252/jcej.17.459.
18 Yoshida F, Akita K. Performance of Gas Bubble Columns: Volumetric Liquid-Phase Mass Transfer Coefficient and Gas Holdup. AIChE J. 11(1) 1965: 9–13; https://doi.org/10.1002/aic.690110106.
19 Pappenreiter M, et al. Oxygen Uptake Rate Soft-Sensing Via Dynamic kLa Computation: Cell Volume and Metabolic Transition Prediction in Mammalian Bioprocesses. Front. Bioeng. Biotechnol. 7, 2019; https://doi.org/10.3389/fbioe.2019.00195.
20 Linek V, Beneš P, Vacek V. Dynamic Pressure Method for kLa Measurement in Large-Scale Bioreactors. Biotechnol. Bioeng. 33(11) 1989: 1406–1412; https://doi.org/10.1002/bit.260331107.
21 Jorjani P, Ozturk SS. Effects of Cell Density and Temperature on Oxygen Consumption Rate for Different Mammalian Cell Lines. Biotechnol. Bioeng. 64(3) 1999: 349–356; https://doi.org/10.1002/(sici)1097-0290(19990805)64:3<349::aid-bit11>3.0.
22 Wang Z, Wang C, Chen G. Kinetic Modeling: A Tool for Temperature Shift and Feeding Optimization in Cell Culture Process Development. Protein Express. Purific. 198, 2022: 106130; https://doi.org/10.1016/j.pep.2022.106130.
23 McHugh KP, et al. Effective Temperature Shift Strategy Development and Scale Confirmation for Simultaneous Optimization of Protein Productivity and Quality in Chinese Hamster Ovary Cells. Biotechnol. Prog. 36(3) 2020: e2959; https://doi.org/10.1002/btpr.2959.
24 Ihling N, et al. Non-Invasive and Time-Resolved Measurement of the Respiration Activity of Chinese Hamster Ovary Cells Enables Prediction of Key Culture Parameters in Shake Flasks. Biotechnol. J. 17(8) 2022: 2100677; https://doi.org/10.1002/biot.202100677.
25 Deshpande RR, Heinzle E. On-Line Oxygen Uptake Rate and Culture Viability Measurement of Animal Cell Culture Using Microplates with Integrated Oxygen Sensors. Biotechnol. Lett. 26, 2004: 763–767; https://doi.org/10.1023/b:bile.0000024101.57683.6d.
26 Sand T, Condie R, Rosenberg A. Metabolic Crowding Effect in Suspension of Cultured Lymphocytes. Blood 50(2) 1997: 337–346; https://doi.org/10.1182/blood.v50.2.337.337.
27 Wohlpart D, Kirwan D, Gainer J. Effects of Cell Density and Glucose and Glutamine Levels on the Respiration Rates of Hybridoma Cells. Biotechnol. Bioeng. 36(6) 1990: 630–635; https://doi.org/10.1002/bit.260360611.
28 Jang JD, Barford JP. Effect of Feed Rate on Growth Rate and Antibody Production in the Fed-Batch Culture of Murine Hybridoma Cells. Cytotechnol. 32, 2000: 229–242; https://doi.org/10.1023/A:1008169417980.
29 Xiu Z-L, Deckwer W-D, Zeng A-P. Estimation of Rates of Oxygen Uptake and Carbon Dioxide Evolution of Animal Cell Culture Using Material and Energy Balances. Cytotechnol. 29, 1999: 159–166; https://doi.org/10.1023/A:1008004618163.
30 Goudar CT, Piret JM, Konstantinov KB. Estimating Cell Specific Oxygen Uptake and Carbon Dioxide Production Rates for Mammalian Cells in Perfusion Culture. Biotechnol. Prog. 27(5) 2011: 1347–1357; https://doi.org/10.1002/btpr.646.
31 Sánchez Pérez JA, et al. Shear Rate in Stirred Tank and Bubble Column Bioreactors. Chem. Eng. J. 124(1–3) 2006: 1–5; https://doi.org/10.1016/J.CEJ.2006.07.002.
32 Nienow AW. Reactor Engineering in Large Scale Animal Cell Culture. Cytotechnol. 50, 2006: 9–33; https://doi.org/10.1007/s10616-006-9005-8.
33 Muralidharan N. Shear-Proof Design Space: Scaling Stirred-Tank Bioreactors for Cell Culture Processes. BioProcess Int. 21(1–2) 2023: 36–38; https://bioprocessintl.com/upstream-processing/bioreactors/shear-proof-design-space-scaling-stirred-tank-bioreactors-for-cell-culture-processes.
34 Kulkarni AA, Joshi JB. Bubble Formation and Bubble Rise Velocity in Gas–Liquid Systems: A Review. Indust. Eng. Chem. Res. 44(16) 2005: 5873–5931; https://doi.org/10.1021/ie049131p.
35 Nyberg G, et al. Modeling of Biopharmaceutical Processes — Part 1: Microbial and Mammalian Unit Operations. BioPharm Int. 21(6) 2008: https://www.biopharminternational.com/view/modeling-biopharmaceutical-processes-part-1-microbial-and-mammalian-unit-operations.
36 Hu W, Berdugo C, Chalmers JJ. The Potential of Hydrodynamic Damage to Animal Cells of Industrial Relevance: Current Understanding. Cytotechnol. 63, 2011: 445–460; https://doi.org/10.1007/s10616-011-9368-3.
37 de Wilde D, et al. Superior Scalability of Single-Use Bioreactors. BioProcess Int.
12(8i) 2014: 14–19; https://bioprocessintl.com/upstream-processing/upstream-single-use-technologies/superior-scalability-single-use-bioreactors.
38 Bhavaraju SM, Russell TWF, Blanch HW. The Design of Gas Sparged Devices for Viscous Liquid Systems. AIChE J. 24(3) 1978: 454–466; https://doi.org/10.1002/aic.690240310.
39 Chisti Y. Animal-Cell Damage in Sparged Bioreactors. Trends Biotechnol. 18(10) 2000: 420–432; https://doi.org/10.1016/s0167-7799(00)01474-8.
40 Zhu Y, et al. NS0 Cell Damage By High Gas Velocity Sparging in Protein-Free and Cholesterol-Free Cultures. Biotechnol. Bioeng. 101(4) 2008: 751–760; https://doi.org/10.1002/bit.21950.
41 Chaudhary G, et al. Understanding the Effect of High Gas Entrance Velocity on Chinese Hamster Ovary (CHO) Cell Culture Performance and Its Implications on Bioreactor Scale-Up and Sparger Design. Biotechnol. Bioeng. 117(6) 2020: 1684–1695; https://doi.org/10.1002/bit.27314.
42 Boulton-Stone JM, Blake JR. Gas Bubbles Bursting at a Free Surface. J. Fluid Mech. 254, 1993: 437–466; https://doi.org/10.1017/s0022112093002216.
43 Boulton-Stone JM. The Effect of Surfactant on Bursting Gas Bubbles. J. Fluid Mech. 302, 1995: 231–257; https://doi.org/10.1017/s0022112095004083.
44 Walls PL, et al. Quantifying the Potential for Bursting Bubbles To Damage Suspended Cells. Sci. Rep. 7(1) 2017: 15102; https://doi.org/10.1038/s41598-017-14531-5.
45 Tramper J, et al. Bubble-Column Design for Growth of Fragile Insect Cells. Bioprocess Eng. 3(1) 1988: 37–41; https://doi.org/10.1007/bf00372858.
Emma Bolduc is a process engineer, Mark Davis is director, and corresponding author Naveenganesh Muralidharan ([email protected]) is senior manager of the manufacturing science and technology (MSAT) team at AGC Biologics, 5550 Airport Boulevard, Boulder, CO 80301; https://www.agcbio.com.
You May Also Like
