Comparison of Concentration Measurement Technologies in Bioprocess Solutions

Trainees attend a QC/Analytical course at BTEC in February, 2014. BIOMANUFACTURING TRAINING AND EDUCATION CENTER
Biopharmaceutical manufacturing involves complex process steps. Exacting production conditions are typically required to maximize the yield, purity, and quality of biological products. In recent years, process analytical technology (PAT) has been increasingly used to monitor key process and performance parameters in real time. That has enabled better control of production conditions. An important parameter required to achieve consistent results in many bioprocessing steps is solute concentration in process fluids.
The Critical Need for Concentration Measurement
Many biopharmaceutical manufacturing process steps require measuring the concentration of solutes in solutions. For upstream processes, concentration of components in feeds and in bioreactors is critical to cell metabolism and growth as well as to ensuring reproducible operations.
In downstream processes, numerous solutions (including buffers) are necessary to execute chromatography and ultrafiltration/diafiltration (UF/DF) steps. Improperly prepared solutions can have significant negative consequences on a downstream process (e.g., product failing to bind to a chromatography column or improper formulation of bulk drug substances).
Consequently, measurement of solute concentration is a critical step in solution-preparation procedures and ensures that solutions have been correctly formulated before their introduction into a process. Furthermore, solutions are monitored in-line during chromatography runs to provide an input control parameter for generating salt gradients, perform in-line dilution of buffers, and monitor that the correct solutions are used in each step (e.g., equilibration, wash, and elution) of a chromatography run.
Measurement of process-fluid concentration is important in cleaning operations to establish proper levels of acids, bases, or detergents in cleaning solutions. Failure to take that measurement can result in inadequate cleaning, damage to system components, and longer system downtimes. Concentration measurement is also used to monitor the water used to flush a system after a cleaning process has occurred to ensure that cleaning agents have been completely removed.
A Snapshot of Concentration Measurement Technologies
Biopharmaceutical manufacturers need complete confidence that process fluids used and generated during both upstream and downstream production operations meet specified concentrations. It is important to have easy-to-use, effective, and efficient methods for measuring concentration. The ideal technique must be reliable and provide high accuracy and repeatability with a fast response time.
Conductivity is a measurement of a solution’s ability to conduct electric current (1). It can be measured by placing a voltage across electrodes, measuring the resulting current, and determining the electrical resistivity (from which conductivity is calculated) of a solution. The extent to which a solute conducts electricity in solution depends on its ionic character and its concentration. Thus, measuring conductivity is a good way to determine the concentration of ionic solutions. But the method is limited in its ability to measure concentrations of solutions containing nonionic and weakly ionic substances, including the constituents in many bioprocessing solutions. Using conductivity to accurately determine the concentration of components in many biopharmaceutical solutions can be difficult.
The pH of a solution is a measure of its acidity or alkalinity. Specifically, pH measures hydronium-ion concentration (2). Therefore, it is an effective indicator of concentration for aqueous solutions of substances that produce hydronium ions when they dissociate. But it has limited use for process fluids that don’t generate hydronium ions.
Osmolality is a measure of concentration based on the change in the freezing point (or freezing-point depression) of a solution due to the presence of a given solute (3). Solutes depress the freezing point of a solution to a value less than that of the pure solvent. Generally, the greater the solute concentration, the greater is the freezing-point depression; therefore, concentration can be correlated to the extent of depression. Unlike conductivity and pH, which are often used as in-line techniques, osmolality is an off-line measurement technique that does not provide real-time information.
Index of Refraction: When a ray of light passes from one medium into another, it is bent at an angle because of the change in the speed at which light travels in each medium. The index of refraction (IoR) of a medium is the ratio between the speed of light in a vacuum and speed of light in that medium (4). Solutions with different concentrations of a given solute will have different refractive indices. So determining a solution’s IoR provides a direct measurement of its concentration.
With traditional refractometers, a light source is shined on a sample, and the light travels through a solution. That way, an analyst can determine light transmission. However, results using such an approach can be affected by turbidity in a solution and by diffraction and absorption of the light (1).
A newer reflective IoR technique uses a light-emitting diode (LED). Rays of light from the LED are shined onto an optical window, which is in contact with process fluid or product solution to be analyzed. The light reflects off the optical window except at the critical angle (θc), where it is refracted into the fluid. That angle can be determined by analyzing the reflected light using a photodiode array detector. The critical angle depends on solution concentration. So an analyst can rapidly detect changes in that concentration. Results using this approach are unaffected by turbidity in a solution or by diffraction and absorption of light.
Unlike conductivity and pH, the refractive index of a solution is independent of its electric or acidic properties. Because the IoR of solutions can be determined very rapidly, the technique is suitable for in-line analysis with real-time data, which allows immediate response to process variations. Furthermore, IoR monitoring readily scales from laboratory to commercial production without loss of accuracy or precision. That makes the technique appropriate for biopharmaceutical applications that need concentration monitoring.
Motivation, Materials, and Methods
The main purpose of this work was to compare the performance of conductivity, IoR, and osmolality for measuring the concentration of different types of solutions frequently used in biopharmaceutical manufacturing. The Golden LEAF Biomanufacturing Training and Education Center (BTEC) at North Carolina State University conducted this analytical technology evaluation.
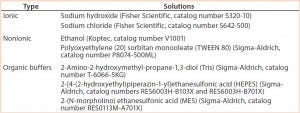
Table 1: Solutions subjected to concentration analysis
For the assessment, we prepared several different aqueous solutions commonly used in biopharmaceutical processing (Table 1). We measured the conductivity, IoR, and osmolality of each solution. We chose the solutions to include a range of different solutes at different concentrations. Those solutes can be classified as ionic, nonionic, or organic buffers. We prepared the organic buffer solutions at the pH values at which they would likely be used in a biopharmaceutical process and without pH adjustment.
For each solution, we measured conductivity, refractive index, and osmolality using conductivity meter model 220 (Denver Instruments), IoR concentration monitor model BT128 (Entegris), and microosmometer model 3320 (Advanced Instruments), respectively. We graphed the response of each test method (conductivity, IoR, and osmolality) against concentration for each solution. A linear response is an important method attribute because it allows for simple quantification of solution concentration. So we used linearity of the responses to assess method effectiveness.
Results and Discussion
We describe below the results for each solution studied.
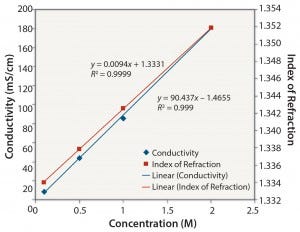
Figure 1: NaCl: conductivity and index of refraction performance
Ionic Solutions: Figures 1 and 2 show results for solutions of NaCl at concentrations ranging from 0.1 M to 2 M. Each method gave a reasonably linear response. However, the osmolality of solutions with a high concentration of NaCl (2 M) could not be determined because the freezing point of the sample was too low (beyond the range of the osmometer used in this study).
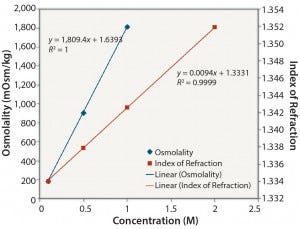
Figure 2: NaCl: osmolality and index of refraction performance
We performed similar measurements for NaOH solutions (data not shown). However, like results for NaCl, the osmolality of the highest concentration of NaOH (2 M) was beyond the range of the osmometer. In addition, the conductivity of 2 M NaOH also was beyond the range of the meter (300 mS/cm). So neither conductivity nor osmolality could provide a reading over the range of concentrations studied. By contrast, IoR gave a linear response over the entire concentration range.
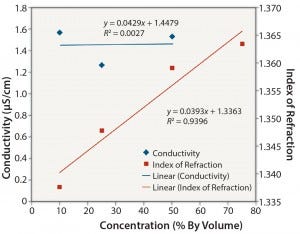
Figure 3: Ethanol: conductivity and index of refraction performance
Nonionic Solutions: Figures 3 and 4 show conductivity, IoR, and osmolality measurements for ethanol solutions. No detection method provided completely linear responses over the range of concentrations studied (10–75% v/v). However, the IoR method provided the best results of the three methods tested. As expected, conductivity values for the ethanol solutions are quite low and not linearly related to concentration. The solutions with concentrations ≥0.25 v/v alcohol did not freeze. So we could not determine their osmolality. As with the ionic solutions, IoR gave the best linear response over the entire concentration range.
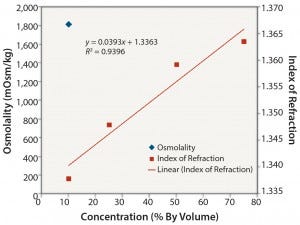
Figure 4: Ethanol: osmolality and index of refraction performance
Measurements for solutions of polysorbate 80 showed similar results to ethanol solutions. IoR and osmolality measurements for polysorbate 80 solutions were linear throughout the 0.5–5% v/v concentration range (data not shown). Unlike the results for ethanol, a plot of conductivity and concentration of polysorbate 80 shows some linearity based on the coefficient of determination value for the linear least squares fit. Because polysorbate 80 is nonionic, this result was unexpected. However, conductivity values measured were low (all 5 µS/cm or less), and the precision of measurement at this low range is quite low.
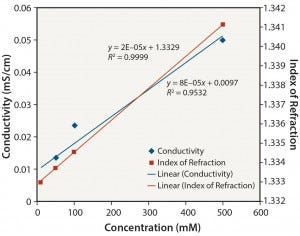
Figure 5: Tris no pH adjustment: conductivity and index of refraction performance
Organic Buffers: Similar results were obtained for all three organic buffers (2-(N-morpholino) ethanesulfonic acid (MES); 2-amino- 2-hydroxymethyl-propane-1,3-diol (Tris); and 2-[4-(2-hydroxyethyl) piperazin-1-yl]ethanesulfonic acid (HEPES)) at the different pH values tested. Figures 5–8 show data for Tris unadjusted and adjusted to pH 8. Tris solutions at pH 8 over a 10–500 mM concentration range showed a linear response for all measurement methods.
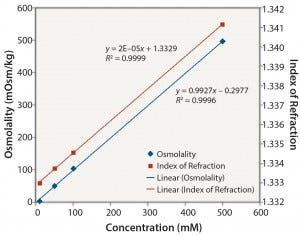
Figure 6: Tris no pH adjustment: osmolality and index of refraction performance
Notably, the relationship between conductivity and concentration is not as linear without pH adjustment. Those organic buffers are only weakly ionic, and accuracy and precision are affected at low conductivity values. The linearity of conductivity data for pH-adjusted Tris is a result of the acid (in this case, HCl) used to adjust the pH to 8.
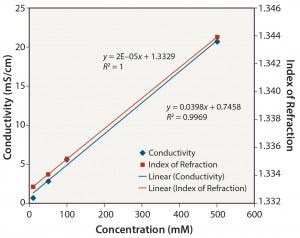
Figure 7: Tris pH 8: conductivity and index of refraction performance
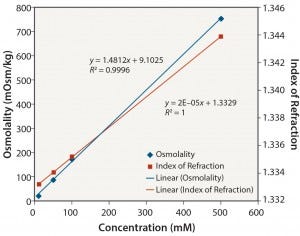
Figure 8: Tris pH 8: osmolality and index of refraction performance
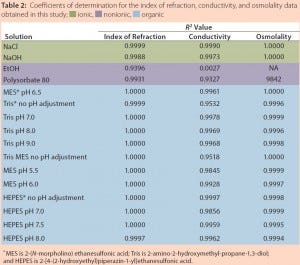
Table 2 summarizes the coefficients of determination (R2) obtained for the various solutions for each analytical method used. R2 is a statistical measure of how close data are to a fitted linear regression line (5). The table clearly shows that conductivity is an appropriate method for determining the concentration of ionic solutions and organic buffers. It is not a suitable method, however, for determining the concentration of nonionic solutions.
The results in Table 2 also reveal that although osmolality is appropriate for most solutions evaluated in this study, higher solute concentrations can result in undetermined osmolality values because of a lack of freezing. It should also be noted that osmolality is an off- line method and cannot be used for in-line analysis. Notably, Table 2 shows that only IoR gave linear responses for all of the solutions at all concentrations.
We observed good precision for all methods, although repeatability of the conductivity tests was slightly lower than that for IoR and osmolality tests, particularly at low conductivity values. Specifically, frequent calibration was required for conductivity measurements, and time was required for readings to stabilize.
Effective Concentration Measurement
With ior Method Quality control in biopharmaceutical manufacturing is crucial for production of safe and efficacious biologic drugs. Accurate concentration measurement of process fluids used in biopharmaceutical production is critical for ensuring consistent processing, leading to acceptable product quality and yield. Development of in-line PAT methodologies has increased the ability for companies to perform real-time monitoring and control of bioprocesses.
For concentration measurement, this study shows that IoR technology compares favorably with traditional methods of concentration measurement such as conductivity and osmolality. IoR methods produced solid linear correlations to concentration for all solutions tested. Because IoR enables effective, real-time concentration measurements with a high level of accuracy and precision across a wider concentration range for many different types of reagents commonly used in biopharmaceutical manufacturing, it has great potential for real-time, in-line measurement of process fluid concentration.
References
1 Electrical Conductivity (σ) and Resistivity (ρ). US Environmental Protection Agency. www.epa.gov/esd/cmb/GeophysicsWebsite/pages/ reference/properties/Electrical_Conductivity_and_Resistivity.
2 CADDIS: The Causal Analysis/Diagnosis Decision Information System, Volume 2: Sources, Stressors, and Responses; pH. US Environmental Protection Agency; www.epa.gov/caddis/ssr_ph_int.html.
3 Lobdell DH. Osmometry Revisited; www.osmolality.com/pdf/ Lobdell%20-%20Osmo%20Revisit.pdf.
4 Refractive Index Theory. University of Toronto Scarborough; http://webapps.utsc.utoronto.ca/chemistryonline/refractive.php.
5 Frost J. Regression Analysis: How Do I Interpret R-squared and Assess the Goodness-of-Fit? The Minitab Blog 30 May 2013; http://blog. minitab.com/blog/adventures-in-statistics/regression-analysis-how-do-i- interpret-r-squared-and-assess-the-goodness-of-fit.
Corresponding author Michael W. Johnson is a global bioprocess applications manager ([email protected]), and Kevin Golden is business development manager at Entegris. Gary Gilleskie is director of operations and teaching associate professor at BTEC. Jennifer Pancorbo is assistant director of bioprocess services at BTEC, and Railton Ribeiro Vilhena is a student at Universidade Federal de Sergipe.
You May Also Like
