Understanding and Controlling Sources of Process Variation: Risks to Achieving Product Critical Quality Attributes
October 16, 2014
https://bioprocessintl.com/wp-content/uploads/2014/10/102014_Hutchison.mp3
Biopharmaceuticals include recombinant proteins, vaccines, gene therapies, and drug products derived from stem cell technology. One key characteristic of shared by all biologics is that they tend to be extremely large molecules with complex three-dimensional structures, critical to their functionality. For example, monoclonal antibodies (MAbs) are composed of more than one thousand times larger than a molecule of aspirin (one analogy compares the complexity of a MAb to that of an F16 jet, and the complexity of aspirin to that of a bicycle) (1).
A single vial of a biological drug product could contain a heterogeneous mix of molecules — all transcribed and translated from the same gene but with subtle differences derived through posttranslational modification processes. For example, Kontroravdi et al. describe how Herceptin (trastuzumab), the MAb treatment for breast cancer, has an N-linked glycosylation profile made up of seven different glycoforms — each present in different proportions (Figure 1) (2). Those different forms can exhibit varying levels of biological activity that may be positive or negative to the drug’s activity within the body. Either way, manufacturers must achieve comparability with the product profile tested in clinical trials if they want to ensure that a drug is safe and efficacious.
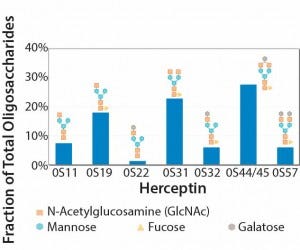
Figure 1: Experimental oligosaccharide profiles for Herceptin (recreated from “Application of Quality by Design Paradigm to the Manufacture of Protein Therapeutics,” by del Val et al.)
Given that quality cannot be tested into drug products, manufacturers have achieved product consistency through process consistency during scale-up and transfer and between batches and campaigns. Quality by design (QbD) allows manufacturers to operate processes within a specified design space so long as target product profiles and critical quality attributes are met (3). In both cases (ensuring quality through process consistency or with QbD), successful filing with regulatory agencies will require that manufacturers
understand the sources of variation
detect the presence and degree of variation
understand the effects of variation on processes and ultimately on product attributes
control variation in a manner commensurate with the risk it represents to processes and products (4).
Those requirements do not mean that all variations necessarily have a negative effect on product quality; indeed, many sources of variation will not. We in the industry are custodians of an existing process that generates product to make sick people better. Our processes may be merely the gleams in our eyes while we reflect on an innovative future biologic, but it surely behooves us to consider how variation might be introduced into our processes. We must try to guide our products at each step to their final successful lot release.
Sources of Variation Survey
Sources of bioprocess variation can be divided into four main categories: biological factors; raw materials and consumables; operational inputs (measurements, methods, personnel, and equipment); and environmental conditions. My company recently conducted a small survey of the industry. Participants were asked, “Which source of process variation represents the greatest risk to achieving product critical quality attributes?”
Results indicate that biological variation was the respondents’ main concern, although variations derived from raw materials and consumable constituted a close second (Figure 2). Our results highlight that the industry is dissatisfied with the reproducibility of materials received through their supply chains. One in five respondents indicated that operational influences were the major risk to achieving product critical quality attributes, and only 10% considered the environment as the major risk (Figure 2).
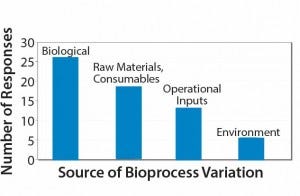
Figure 2: Survey responses to the question “Which source of process variation represents the greatest risk to achieving product critical attributes?”
Here I describe the above sources of variation in greater detail and discuss ways in which they can or have been controlled.
Biological Variation
This type of variation occurs because our processes demand the use of highly complex living organisms and the millions of biochemical pathways they contain. Narum reports that during development of a recombinant protein malaria vaccine, the number of product variants as a result of O-linked mannosylation were considerably reduced by overexpression of a chaperone protein called PDI (5). Eliminating heavily mannosylated species can have a very positive influence on product efficacy because mannosylation can be a trigger for proteins to be cleared more rapidly from a patient’s body, thereby reducing therapeutic effect (5).
Variability in product quality can occur if changes are made to cell lines, media, or other cell-culture conditions from small-scale to full commercial- scale manufacturing. Cell-line changes are generally best prevented during clinical development because they are considered major process changes and require manufacturers to conduct product comparability studies. Cell line selection therefore becomes a critical decision. During clonal selection, molecular integrity, aggregation, glycosylation, and charge heterogeneity all can be studied as part of clonal selection criteria to achieve the desired product quality (6).
Optimization of cell culture process parameters can significantly reduce product variability. My company has experience in making small-scale bioreactor glucose feeds, both manually and under gravity. Automating those feeds can reduce the potential for process variability, because the timings and rates of addition can be more easily controlled. Even though such feeds might seem to be relatively simple suboperations, they actually have the potential to introduce error from multiple operator-involved steps. Eliminating or at least reducing the number of human-source factors through automation can increase process consistency and robustness.
Automation also can enable a greater amount of data capture, which then can be fed back into the analysis of process variability through the use of multivariate statistical techniques in line with the FDA’s guidance on process analytical technologies (7). The full benefits to automating bioreactor feeds can be realized when appropriate sensors provide feedback to the automation process. Such sensors can be used to optimize timing and rate of feed additions, which then helps processes to achieve desired product quality profiles.
Raw Materials and Consumables
These substances are input directly into processes and exhibit variation in their own right. Section 7 of ICH Q7 provides guidance on managing materials that enter manufacturing facilities. Lowe has highlighted the fact that single-use technologies introduce material variability at the equipment level and the need to control the risk of unexpected performance by process and raw material inputs (9). He described how a three-component science- and risk- based approach is used to characterize raw materials through
supply chain and technical due diligence
raw material characterization and process impact assessment
continuous monitoring and verification.
For example, my company successfully reduced variation in a client’s overmolded single-use manifold products by working with our tubing supplier. The supplier had been providing tubing that was within specified tubing limits, but the tubing came from two different tubing diameter distributions — one at the low end of the specification and one from the high end (Figure 3).

Figure 3: Original tubing diameter populations provided by the supplier for manufacturing overmolded manifolds (from Parker dominick hunter)
Variable-quality (tubing diameter) manifolds resulted when the manifold manufacturing process switched from one of these populations to the other. Our solution was to work with the supplier to ensure that the company deliver tubing from only one distribution, thereby minimizing the effect on the variation entering our customer’s bioprocesses.
Operational Inputs
Measurements, methods, personnel, and equipment are sources of variation derived from how we operate bioprocesses within our facilities. During its lifetime, a given bioprocess can be operated by a number of people, at different times, and different scales, in different facilities, by different companies, and perhaps different continents. A complete discussion of how operational variation is controlled throughout a product’s life-cycle is beyond the scope of this article.
One example of how operational input variation can be reduced is the automation of often manual single-use unit operations. My company recently worked on a project whereby a final filtration and bulk dispense operation was automated for a contract manufacturer customer. The customer need to filter and dispense 80 L and more of final drug substance into aliquots of 100 mL to 2 L. The company previously performed that operation in a vertical-laminar-flow cabinet. The complex and very manual
operation involved many substeps: from flushing the filter to performing the filtration and postuse integrity test to dispensing into bulk-fill containers. Multiple air purges were required to maximize product recovery.
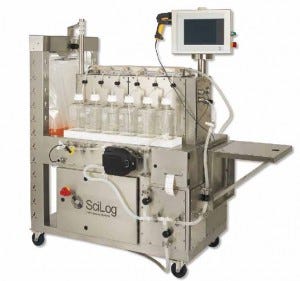
Photo 1: Single-use automated system for the final bulk filtration and dispense of biopharmaceuticals
Designing a single-use system that automates this process allowed for standardization of the step among operators, batches, and campaigns, and it also minimized the risk of human errors (Photo 1). Some reports have estimated that around half of all deviations in the industry can be attributed to this type of error (10). So the benefit of automation in reducing process variation is clear.
Less clear perhaps (and an interesting discussion topic for the industry) the appropriate level of automation within bioprocessing. Results of a small survey my company performed recently revealed that only 10% of respondents replied that fully manual operations were appropriate. About 60% of participants indicated that semiautomation was right for their processes.
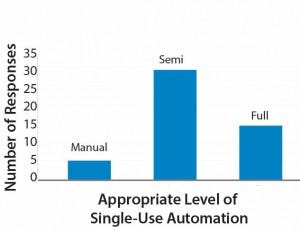
Figure 4: Appropriate Level of Single-Use Automation
The remaining 30% expressed a preference for full automation (Figure 4). Those categories are broad, and semiautomated in particular will mean different things to different operators. Based on my company’s experience, however, we have found that some facilities would benefit from preventing full automation (e.g., with electronic batch records and electronic signatures), even within good manufacturing practice (GMP). A full level of automation can increase project costs (e.g., those associated with commissioning), particularly for contract manufacturers and some innovator companies. So manufacturers must carefully evaluate their level of automation needed.
Environmental Factors
The environment can be a source of variation, although perhaps it is considered to have less influence than in classical pharmaceutical manufacturing, where parameters such as humidity can modify chemical reactions. Nevertheless, some biological operations are performed within temperature specifications to maximize product stability. So variations within temperature ranges presumably can contribute to overall product variation.
One significant source of potential variation derived from the environment of a facility is microbial contaminations. Contamination of a bioreactor is likely to be batch- terminating event. Few biologics manufacturers claim sterile processing, and a degree of bioburden is tolerated within downstream processes. Without appropriate controls in place, the nature and magnitude of this bioburden would clearly affect product quality.
My company sees a trend within the industry whereby clients are seeking to change their strategies for reducing microbial contaminations away from facilities with expensive air-handling systems and classified rooms to closed-system processing. The automated bulk filtration and dispense system described above was designed to be a completely closed system. It eliminates the need for vertical laminar-flow cabinets that are expense to run, maintain, and validate.
Identify and Control Variation
The FDA’s guidance document on process validation recommends that biomanufacturers understand the sources of variation in their process and seek to control it. Not all process variations will have a detrimental effect on product quality. However, to establish the appropriate risk management tools, you should
consider all potential variability sources. Sources of variation include biological factors, raw materials and consumables, operational input, and a facility’s environment. Understanding variation and seeking ways of controlling it can effectively allow manufacturers to maximize patient safety for their products. Companies can then enhance the manufacturability of future biologics in whatever form they should take.
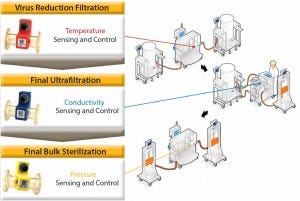
Figure 5: The role of process analytical technologies in controlling three unit operations used in biopharmaceutical purification
Reducing Variation Through Sensing and AutomationThe FDA’s guidance document on process analytical technologies (PAT) describes PAT as “a system for designing, analyzing, and controlling manufacturing through timely measurements of critical quality and performance attributes of raw, in-process materials and processes with the goal of ensuring final product quality” (7). The PAT toolbox comprises multivariate tools for design, data acquisition and analysis, process analyzers, process control tools, and continuous improvement and knowledge management tools. The role of analyzers or sensors linked to automation as a means for controlling processes to ensure final-product quality can be demonstrated with the following example for three unit operations at the end of a purification process for a recombinant protein derived from cell culture. The three steps are the virus-reduction filtration, final ultrafiltration, and the sterile bulk filtration (Figure 5). Virus-Reduction Filtration: Our clients monitor and control the temperature at which they perform virus-reduction filtration. There is a theoretical risk variations in temperature can affect the polymeric structure of a virus filter or the mechanism of virus retention, which is a critical risk to patient safety. Use of in-line temperature sensors during this operation allow bioprocessors to document that an operation was within validated temperature ranges. Such sensing technology could also form the basis for an automated temperature control strategy using heat exchanger technology. Final Ultrafiltration: Controlling conductivity during a final ultrafiltration step is extremely important because this operation easily could be the final conductivity measurement of a drug product before it enters a vial. In-line conductivity measurements enable bioprocess operators to know when the conductivity specification of a bulk drug substance has been met. If the specification has not been achieved, then additional diavolumes of the final formulation buffer can be added until the value is brought within limits. Final Bulk Sterilization: In-line pressure sensors are used to control both final bulk sterilization-filtration operations, but such sensors would be equally applicable to the virus filtration step described previously. In both cases, the validated cross-filter pressure drop must not be exceeded. In-line pressure sensors allow manufacturers to document that the pressure was within specification throughout the course of the step. We come across numerous examples of biomanufacturers performing critical sterile and virus filtration operations manually. Very often, they take pressure readings periodically because evidence limits are not exceeded. However, such practice presents a clear risk that limits could have been exceeded during the time intervals between measurements. Pressure-sensor readings can be fed back to automation equipment to control the process and minimize variation. Our automated processes will maintain a constant flow rate until the pressure increases as a result of filter blockage reaching the limit set by operators. Clearly, that limit must be set below the validated limit for a process. Once the pressure limit is met, a system will automatically decrease the flow rate, thereby allowing more product to be processed without exceeding at limit. |
References
1 Gupta D, Prashanth GN, Lodha S. A CMO Perspective on Quality Challenges for Biopharmaceuticals. BioProcess Int. 11(9) 2013: 20–26.
2 Jimenez del Val I, et al. Application of Quality by Design Paradigm to the Manufacture of Protein Therapeutics. InTech 2012; http://dx.doi.org/10.5772/50261.
3 ICH Harmonized Tripartite Guideline: Pharmaceutical Development Q8(R2). International Conference on Harmonisation of Technical Requirements for Registration of Pharmaceuticals for Human Use: Geneva, Switzerland, 2009.
4 Guidance for Industry: Process Validation, General Principles and Practices. US Food and Drug Administration: Silver Spring, MD, 2011.
5 Narum D. Molecular Design of Recombinant Malaria Vaccines Expressed By Pichia pastoris. Quality by Design for Biopharmaceuticals. Rathore A, Mhatre R, Eds. Wiley & Sons: New York, NY, 2009.
6 Li F, et al. Cell Culture Processes for Monoclonal Antibody Production. MABs 2(September–October) 2010: 5.
7 Guidance for Industry: PAT — A Framework for Innovative Pharmaceutical Development, Manufacturing, and Quality Assurance. US Food and Drug Administration: Silver Spring, MD, 2004.
8 ICH Harmonized Tripartite Guideline: Good Manufacturing Practice Guide For Active Pharmaceutical Ingredients, Q7. International Conference on Harmonisation of Technical Requirements for Registration of Pharmaceuticals for Human Use: Geneva, Switzerland, 2000.
9 Lowe D. Bioproduction, Dublin, Ireland, 2013.
10 Poncin A. How to Make the Most Out of Your Data to Produce Knowledge Which Will Shorten R&D Cycle Times and Reduce Costs. PAT & Quality by Design (IQPC), London 2014.
Nick Hutchinson is a global market development manager at Parker domnick hunter; [email protected].
You May Also Like
