Voices of Biotech
Podcast: MilliporeSigma says education vital to creating unbreakable chain for sustainability
MilliporeSigma discusses the importance of people, education, and the benefits of embracing discomfort to bolster sustainability efforts.
Today’s biomanufacturing operations require constant management of biopharmaceutical process attributes throughout process development and production. Continuous online measurements of pH, dissolved oxygen (DO), oxidation–reduction potential (ORP), and conductivity (Figure 1) allow real-time industrial process monitoring and adjustment. These functions are crucial to process improvement studies and accurate, reliable manufacturing of high-quality products.
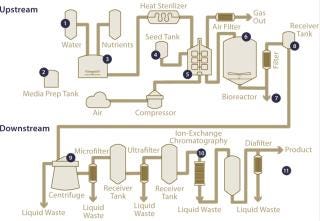
“In the pharmaceutical industry, it is extremely valuable to see how an attribute changes with time and correlate that change with parts of the process,” says L. Harry Lam, PhD, a biopharmaceutical manufacturing industry expert. “It is imperative to have effective equipment that provides reliable measurements.”
PRODUCT: ALL BIOLOGICALS
PROCESS FOCUS: Production
WHO SHOULD READ: Process development, facilities, and manufacturing
KEYWORDS: QUALITY SYSTEMS, MICROBIAL FERMENTATION, PROCESS MONITORING AND CONTROL, WIRELESS TECHNOLOGY, OPTICAL SENSORS
LEVEL: BASIC
Accuracy, repeatability, response time, and detection limits are important, and so are easy installation, calibration, and maintenance. Until the past few years, sensor technology was not keeping pace with improvements in cell engineering processes, which have been scaled up and modernized considerably. But three recent advances — optical DO sensor technology, “smart” sensors, and wireless technology — are improving data quality and the ease with which information is obtained and managed. Here we describe those advances and present two examples of wireless smart sensors in use: at an innovative, large-scale biopharmaceutical manufacturing plant and a scaled-down simulator for studying the impact of industrial-scale inhomogeneities on microbial cultures in a laboratory setting.
Dissolved Oxygen Sensor Technology Advances
New optical DO process sensor technology was introduced for the biopharmaceutical industry in 2007 (1). In the classical amperometric (electrochemical) procedure as described by Clark, oxygen diffuses through a membrane and induces a chemical reaction with the electrolyte behind it (1). That creates a voltage differential proportional to the amount of oxygen present in the system.
Optical measurements are based on fluoresecnt quenching of a luminophore when oxygen is present. The intensity and phase shift of emitted light depends on the amount of oxygen present. That light is trapped and measured. The light system is located behind the membrane cap and protected by sapphire glass.
The new sensors replace traditional Clark cells, which were based on electrochemical measurement within each sensor itself. Because of pressure effects on the fluid-filled membrane cap, however, classical amperometric sensors could give inaccurate readings when they were exposed to pressure and temperature changes. That makes it difficult to assess the status of a culture, triggers alarm systems unnecessarily, and can disrupt daily operations. By contrast, optical DO sensors have more rugged sensor caps that easily handle broad performance ranges, accommodating temperatures from –10 °C to 80 °C, pressures up to 12 bar (174 psi), and pressure spikes up to 80 bar (Table 1).
Table 1: Technical specifications for the Hamilton VisiFerm DO optical DO sensor.
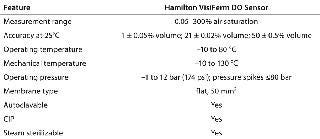
Figure 2 illustrates the performance difference between amperometric and optical DO sensors. Figure 2, TOP, presents the readings of one amperometric and three optical sensors for a stop-flow process in which the sudden stoppage of flow sends a shock wave (pressure hammer) through the liquid. That pressure hammer transfers through the electrolyte-filled membrane of the amperometric sensor, causing a massive disturbance of the oxygen equilibrium on both sides of that membrane. Optical oxygen sensors are resistant to pressure hammers because they lack such a fragile membrane and electrolytes inside the membrane cap. As seen in Figure 2, TOP, the amperometric sensor triggered an oxygen-level alarm several times during the study, whereas the three flow-dependent optical sensors provided consistent readings.
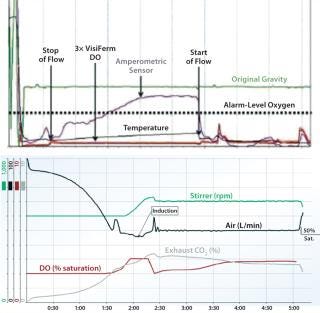
Optical DO sensors are also better suited to modern biopharmaceutical processes that require steaming-in-place (SIP), cleaning-in-place (CIP), and autoclaving. By comparison, amperometric sensors recover slowly after cleaning because they rely on requilibration of electrolytes across a fragile membrane, and their signal quality deteriorates with repeated sterilization. Slow recovery extends downtime and can lead to waste if sensors are not fully responsive before restarting a process. With no electrolytes that would require polarization time, optical sensors retain their stability over a number of sterilization cycles (Figure 2, BOTTOM).
Smart Sensors
Bioprocess operation performance has also been hindered traditionally by difficulties in transmitting information to and from sensors. Recent introduction of so-called “smart sensors” facilitates both sensor and data management.
A smart sensor contains a memory chip embedded in its electronic circuitry to store identification and calibration information. The memory chips provide several benefits. They eliminate the need for in-line calibration, reducing system downtime. They reduce incorrect estimations of sensor life, lowering the instance of batch failures attributable to sensor failure. And they eliminate the need for extensive manual documentation of sensor performanc
e to meet quality system reporting requirements, which in turn reduces overall administration costs.
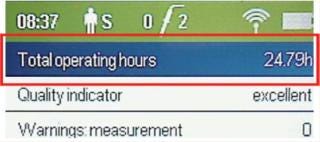
Smart sensors self-monitor their own measurement performance. An intrinsic quality indicator will predict a failing sensor before a bioreactor run starts, reducing the risk of in-process failure and maximizing the useful life of each sensor instead of relying on a set replacement schedule. Out-of-range results are reported immediately, triggering alarms and prompting operator action as appropriate. Figure 3 is an example of a sensor quality readout.
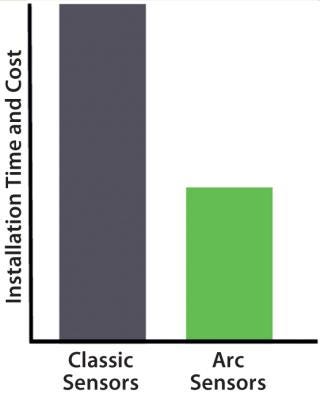
Because smart sensors store calibration data, precalibration and configuration are possible right in the laboratory. Costs associated with installation and downtime are reduced by more than half with smart sensors (Figure 4). “Smart sensors improve time to market, allowing less complex setup and faster qualification,” says Lam.
Finally, smart sensors report identification and calibration information electronically. This provides for better quality system adherence and saves time that was previously spent on manual documentation.
Wireless Technology
Nearly everyone today is familiar with wireless information transfer in some form. The same technology that enables the function of cellular phones and other common devices can also be used to create wireless sensor networks in pilot laboratories and in new bioproduction facilities. Such technology reached the biopharmaceutical process sensor industry with Hamilton Company’s introduction of the Arc sensor system.
Wireless adapters for sensors are available for a broad range of pH, DO, ORP, and conductivity measurement applications. Wireless sensors feature a built-in microprocessor that communicates with analog (4–20 mA) and digital Modbus interfaces. (Modbus is a standard serial communications protocol commonly used in connecting industrial electronic devices. It was developed with industrial applications in mind.) Direct connectivity eliminates the need to send information through costly transmitters, and the wireless signals are more robust and reliable than the low currents produced in traditional measurement systems. Arc sensors contain smart sensor technology and can be precalibrated and configured by the vendor. In addition, on- and offline sensor management delivers extended sensor life and increases process accuracy in challenging bioproduction environments.
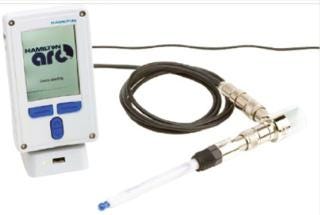
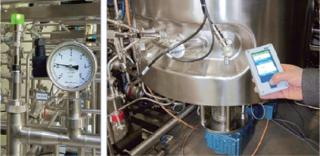
In the Hamilton system, an Arc Wi sensor adapter and an Arc View handheld unit enable wireless management and calibration of multiple sensors using one device. The handheld unit (Figure 5) provides a local display configured with Arc Wi wireless communication, which enables users to move around a facility and monitor data from multiple sensors, communicating with up to 31 of them simultaneously. Figure 6 shows a manufacturing plant installation with an Arc sensor unit in active transmission mode.

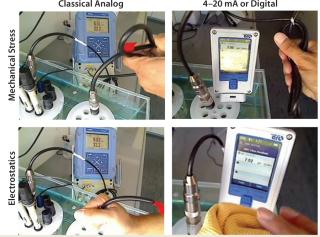
Improving Data Quality with Wireless Sensor Technology: In addition to the more obvious benefits of monitoring data from multiple sensors using a handheld device, wireless sensor technology also provides a marked improvement in data quality. Wireless capability eliminates not only the fixed transmitter and connective cabling between it and the sensors, but also other hardware that can cause signal interference. Poor sensor–transmitter connections, breaks and shorts in existing cabling, and sensitivity to electromagnetic fields from nearby motors are just a few well-known interference sources that can frustrate plant operators. Figure 7 illustrates the dramatic improvement in data quality that is enabled by removing cables as a source of interference.
“Beyond the advantages of convenience, flexibility, cleanliness, and elimination of wiring costs,” says Lindsay Leveen, a bioprocess industry strategist, “removing intrusive wiring ensures quality by reducing penetrations into the system.”
Lower Costs of Smart, Wireless Sensors:Table 2 lists the costs for installing and maintaining wireless smart sensors using the Hamilton intelligent Arc VisiFerm DO (an optical DO sensor) as an example. For operation of a single-sensor system over a two-year period (including installation and one additional year of maintenance), a smart wireless sensor costs about the same as its traditional hard-wired counterpart. Wi
reless technology provides significant savings when multiple sensors are needed largely by replacing individual transmitters with a single, less expensive, wireless set-up. For a five-sensor installation, using a wireless installation with one year of maintenance costs 29% less than would multiple separate traditional transmitters.
Table 2: Cost comparison (in US dollars) for single- and five-sensor installations of optical DO sensors with and without wireless capability; the second-year cost is for a replacement cap.

Case Studies
A Modern, 750-L Fermentation Plant Including a Cross-Flow Unit: When planning a modern, 750-L fermentation plant including a cross-flow unit, a biopharmaceutical manufacturer needed the best available measurement technology to meet its regulatory requirements. After testing Hamilton’s new smart Arc system, the plant engineer found that it met the company’s needs for efficiency, compactness, reliability, and precise process controls (Figure 8).
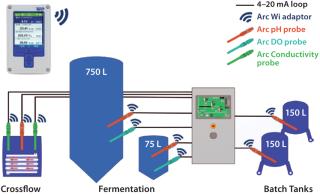
Hamilton Arc sensors were installed in the plant, which contains nine measurement points for pH, DO, and conductivity. The intelligent wireless sensors provide measurement value, sensor quality information, operating time, CIP/SIP count, product numbers, and calibration data (Figure 9).
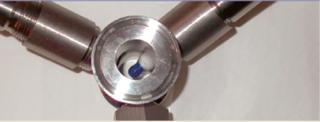
Wireless Smart Sensors in a University Setting for Research in Simulated, Industrial, Large-Scale Processes: In a bioprocess engineering laboratory, the combination of a plug-flow reactor (PFR) and common stirred-tank bioreactor (STR) are used to study the impact of inhomogeneities on Bacillus subtilis cultivations. To accurately mimic large-scale conditions, operators needed reliable measurement of pH and DO along their PFR (Figure 10). They chose to use Hamilton smart Arc sensors, such as the VisiFerm DO Arc 120 and the Polilyte Plus Arc 120 pH models. In Figure 10A, the numbers correspond as follows: (1) recirculation; (2) 11-mm sampling ports; (3) PFR; (4) insulation; (5) STR; (6) bioreactor outlet; (7) PFR feed; (8) pump; and (9) optional PFR aeration.

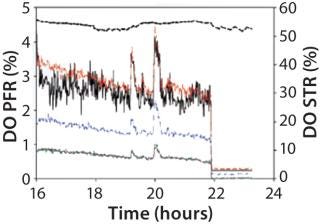
A PFR — also known as a continuous tubular reactor (CTR) — is a continuously flowing reaction system. It can be perceived as a tube in which the reaction medium flows in distinct packets (plugs) of varying composition in an axial direction. PFRs are typically used for continuous production. Such a model system was used to examine the metabolic response of nonsporulating B. subtilis mutant strains to oscillating substrate and oxygen availability. When air was supplied from the bottom (Figure 10A, number 9), the DO concentration was higher at the second monitoring port than at the first (Figure 11) because of gas dispersion. DO concentration declined as the air plug moved through the PFR.
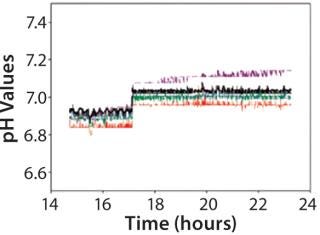
Operators also monitored pH in both the PFR and the STR (Figure 12). In that study, the pH measurement along the PFR module did not indicate acid release. Monitoring pH is especially useful when acids are formed in a PFR reactor — for example, in Escherichia coli cultivation.
Looking Forward
The introduction of optical DO sensor technology, intelligent sensors, and wireless technology enables more reliable biopharmaceutical production and improved plant performance. Biomanufacturers will face challenges as they strive for continuous improvement. In sensor technology, industry experts such as Lam would like to see more measurement innovations, such as a reliable method for measuring glucose online.
From a broader perspective, Leveen considers single-use technology to be the next major trend in biopharmaceutical manufacturing. An early adopter of disposables for biopharmaceutical production, he says, “Because FDA regulation of therapeutics begins with clinical trial material, the introduction of single-use bioprocess technology will begin at this stage in therapeutic development.”
Both industry suppliers and pharmaceutical company experts concur. Lam and others insist that cost will be a driving factor in the decision-making process for years to come. To succeed in the future biomanufacturing market, newly introduced technologies must cost no more than current technology.
Acknowledgments
The authors are grateful to Stefan Junne, Arne Klingner, Dirk Itzeck, and Peter Neubauer of the bioprocess engineering laboratory in the department of biotechnology at the Technische Universität Berlin for contributed content from the novel plug-flow reactor case study as well as data and photos for Figures 10, 11, and 12.
The authors thank the following industry experts for helpful conversations: Dr. L. Harry Lam, PhD, is a bioprocess engineer who has spent his career in biochemical manufacturing operations for major pharmaceutical corporations. He has been responsible for technology implementation in many successful development projects and manufacturing campaigns. In his current role, he oversees outsourced contract biological drug substance manufacturing for a major biopharmaceutical company. Lindsay Leveen is a manufacturing process industry strategist and early technology adoptor focused on sustainable development. He has led manufacturing technology implementation for biopharmaceuticals, where he was an early proponent of single-use methods. More broadly, he has implemented sustainable development for major corporations in areas such as fuel cells, telecommunications, and power generation and transmission. Currently, he is a consultant and recipient of the American Institute of Chemical Engineers Professional Development award for his lifetime of achievement in chemical engineering.
About the Author
Author Details
Corresponding author Amber Ratcliff is market segment manager for analytical sensors at Hamilton Company, 4970 Energy Way, Reno, NV 89502; 1-800-648-5950. A consultant with GeneCom Group, Carol Preisig, PhD, MBA, provides scientific writing and industry research assistance to the company. Arc, Polilyte, and Arc VisiFerm are registered trademarks of Hamilton Company.
1.) Tillich, D 2007. Hamilton Visiferm DO Sensors: Optical Oxygen Measurement with Built-in Electronics in a 12-mm Format. CHEManager Europe:25.
2.) Cammann, K Gunzler, H and A. 2008.Chapter 28: Chemical and Biochemical SensorsHandbook of Analytical Techniques, Wiley-VCH Verlag GmbH & Co. KGaA, Weinheim:951-1059.
3.) Carloni, A, and A Turner. 2010.Bioprocess MonitoringEncyclopedia of Industrial Biotechnology: Bioprocess, Bioseparation, and Cell Technology, John Wiley & Sons, Inc., Hoboken:1-18.
4.) Rathore, SA, and G Kapoor. 2013.Process Analytical Technology: Strategies For BiopharmaceuticalsEncyclopedia of Industrial Biotechnology: Bioprocess, Bioseparation, and Cell Technology, John Wiley & Sons, Inc., Hoboken:1543-1565.
5.) Sun, J, and L. Chew Patnaik, R. 2012.Rapid Fermentation Process Development and Optimization, in Engineering Complex Phenotypes in Industrial Strains, John Wiley & Sons, Inc., Hoboken.
6.) Sreekrishna, K 2010.Pichia, Optimization of Protein ExpressionEncyclopedia of Industrial Biotechnology: Bioprocess, Bioseparation, and Cell Technology, John Wiley & Sons, Inc., Hoboken:1-37.
7.) Vallejos, JR. 2012. Optical Sensor Enabled Rocking T-Flasks As Novel Upstream Bioprocessing Tools. Biotechnol. Bioeng. 109:2295-2305.
You May Also Like