Voices of Biotech
Podcast: MilliporeSigma says education vital to creating unbreakable chain for sustainability
MilliporeSigma discusses the importance of people, education, and the benefits of embracing discomfort to bolster sustainability efforts.
May 1, 2011
Confirmation of raw material quality is a vital part of biopharmaceutical manufacturing processing. Incorrect or poor-quality vendor materials account for a considerable portion of failed and recalled product. To prevent these expensive problems, strict quality control (QC) procedures are often implemented and used to screen for inappropriate incoming materials. QC procedures commonly used are chemical tests that involve removing samples to a laboratory and performing, which can at times be complex, time-consuming, and laborious protocols. A common test procedure that is considerably easier and quicker to perform than laboratory chemical tests involves near-infrared (NIR) spectroscopy.
Raw Materials Quality Control
Biopharmaceuticals are manufactured using biological or chemical raw materials such as cell culture nutrients, serum components, inorganic salts, detergents, enzymes, growth factors, and other compounds. Low-quality raw materials will result in biopharmaceutical products that are not appropriate for their intended use and may even be harmful. As a result, incorrect or poor-quality raw materials account for a large number of finished product failures and recalls, which damage brand reputations and incur higher costs.
PRODUCT FOCUS: VACCINES, RECOMBINANT PROTEINS
PROCESS FOCUS: Production (cell culture, fermentation)
WHO SHOULD READ: QA/QC, PROCESS DEVELOPMENT, RECEIVING, MANUFACTURING
KEYWORDS: NEAR INFRARED (NIR) SPECTROSCOPY, PAT, PHOSPHATE, BUFFERS
LEVEL: INTERMEDIATE
The process analytical technology (PAT) regulatory framework introduced by the US Food and Drug Administration (FDA) encourages continuous real-time quality assurance as well as innovative development of pharmaceuticals and manufacturing processes. The goal of PAT is to understand and control manufacturing processes — because quality cannot be tested into products but should be built into processes.
Conventional Laboratory Chemical Tests
Laboratory chemical testing has been used in pharmaceutical manufacturing for many years to evaluate the quality of raw materials. Such methods require that samples be taken from the field and transported to a laboratory for testing. However, as the pharmaceutical industry moves toward 100% inspection of incoming raw materials, it can be extremely time-consuming and expensive to collect samples from all containers of raw materials and send them for laboratory analysis. In addition, chemical tests can involve complex, laborious, and lengthy protocols.

The FDA’s PAT regulatory framework specifies in-line analysis of raw materials as a key process for increasing pharmaceutical manufacturing control and verifying product quality before release to the marketplace. NIR spectroscopy has emerged as a viable and effective PAT tool for performing in-line monitoring of raw materials in bioprocessing applications.
NIR Performance
NIR analysis provides spectral information that can be used to identify materials, determine the quality of those materials, and quantitatively measure component concentrations. Robust and fast NIR instruments are particularly amenable for raw-material analysis right at the receiving dock as materials are unloaded. This precludes the need for bringing samples to a laboratory for analysis.
NIR spectroscopy relies on changes in dipole moments caused by molecular vibrations. Typically, those active vibrations are found in organic compounds where bonds between carbon and other atoms allow for relatively easy analysis. Emphasis on organic analysis has led to the often incorrect assumption that inorganic materials such as salts are not suitable for NIR analysis. Although it is true that some inorganic salts do not produce strong NIR spectra, many will have vibrations that are sufficiently active in the NIR region to allow for proper analysis and measurement.
Hydrated inorganic salts are particularly easy to analyze with NIR spectroscopy. In addition, this method can separately identify different polyatomic ions from each other. The real-life case study below demonstrates NIR spectroscopy’s superior capabilities as a powerful method for identifying and qualifying phosphate salts used in the manufacture of ultrahigh-purity cell culture buffers.
Case Study
A bioprocessing company was provided with subquality raw materials for preparing complex cell culture buffers. Those materials were undetectable using its standard quality assurance methods and eventually resulted in >$3 million in lost finished product, investigations, and recovery as well as a damaged reputation. Further complex analysis using inductively coupled plasma mass spectrometry (ICP–MS) on the finished cell culture media traced the subquality raw material to a batch of poorly refined sodium phosphate dibasic (Na2HPO4). More specifically, the poorly refined material contained significant quantities of pyrophosphate ion (P2O7)–4. The presence of that pyrophosphate led to incorrectly formulated synthetic cell culture media, which subsequently damaged, destroyed, and invalidated otherwise healthy bioreactor runs. Subsequent NIR analysis proved that the inferior raw materials provided by the vendor would have been quickly and positively identified and quantified at the receiving dock, if NIR spectroscopy had been used.
Methods: As part of its evaluation, the company used an NIR spectroscopy analyzer (Thermo Scientific Antaris Method Development Sampling system) to successfully identify various phosphate powders and quantitatively determine the mass percent of pyrophosphate in sodium phosphate dibasic raw material. Two separate studies were carried out to achieve those goals: qualitative identification and quantitative measurement.
Qualitative Identification: Six classes of phosphate materials were selected on the basis of their use and potential for use as incoming raw materials: CaHPO4 • 2H2O, K2HPO4, KH2PO4, Na4P2O7, NaH2PO4, and Na2HPO4. These materials represent the variety of minerals that may be refined from phosphoritic ores. Phosphates analysis took place directly inside original containers using a Thermo Scientific SabIR fiber optic probe, whereby spectra were averaged from 16 scans using 8 cm–1 resolution. The analysis included a total of 11 samples from each material.
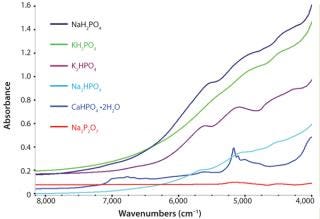
The spectra were subjected to chemometric treatment using Thermo Scientific TQ Analyst software. A discriminant analysis algorithm was selected using multiplicative signal correction in the pathlength. The analysis used raw spectra without preprocessing or derivatives — except for a linear removed baseline to account for baseline shifts due to differences in sample reflection. Spectral regions ranged from 7,400 to 4,100 cm−1. Figure 1 shows spectra from each class. Even though there are only subtle absorbing bands and spectral characteristics in the samples, robust calibration methods were devel
oped.
Quantitative Measurement: This study used 13 samples of sodium phosphate dibasic (Na2HPO4) contaminated with various amounts of anhydrous sodium pyrophosphate (Na4P2O7) ranging from 0 to 15.4% (approximately 0 to 10.0% pyrophosphate ion).
The 13 samples were collected in two-dram vials, which were placed on the integrating sphere module of the instrument. Spectra were averaged from 64 scans using 8 cm−1 resolution. Typically, spectra from each sample were collected twice and then merged in the chemometric analysis. A partial least squares (PLS) method allowed for quantitative prediction of the weight percent of pyrophosphate in the Na2HPO4. Most samples were used to build and develop the PLS chemometric calibration while four samples were not directly used to build the model but were later used as validation standards to test its robustness and reliability. Analysts subjected the standards spectra to a second-derivative preprocessing treatment using a Norris derivative smoothing algorithm (segment 11, gap 5). Analysis region ranged from 7,400 to 4,700 cm−1.
Results
Qualitative Identification: The fully developed discriminant analysis method identified the various raw materials successfully without any errors. There was sufficient spectral variability among the classes that they were clearly separated. Mahalanobis distances indicated how closely each spectrum clustered around the class average. Smaller Mahalanobis distances indicated that a sample was spectrally close to the class average, and larger Mahalanobis distances indicated that a sample fell far away from a particular class average.
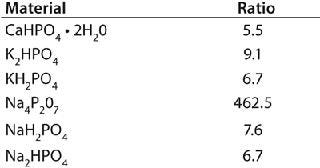
Ideally, each spectrum’s lowest Mahalanobis distance would be to its correctly identified class, and the next highest Mahalanobis distance would be relatively large. Mahalanobis distances can be thought of as the number of standard deviations a spectrum might fall from class average. Distance values <1 indicate that the spectrum is very similar to class average. Table 1 lists average Mahalanobis distance ratios of the closest incorrect classes to the correct classes. Ratios >3 suggest a substantial separation among the clusters of spectra assigned to each class. Note that the ratio for the sodium pyrophosphate is extremely large, indicating that it is considerably different than the next nearest class of material.
Table 1: Ratios of the nearest incorrect Mahalanobis distance to the correct class; results >3 indicate excellent separation among the different groups.
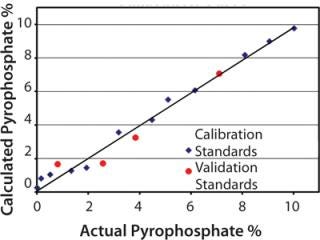
Quantitative Measurement: The PLS method developed from the second-derivative spectra provided a calibration curve with excellent correlation between NIR predicted values and mass percentages determined gravimetrically. Figure 2 shows a calibration curve for the pyrophosphate ion mass percent, which demonstrates this high correlation.
The PLS method also provided low errors. Root mean square error of calibration (RMSEC) was calculated from the standards for developing the method. Calculation of root mean square error of prediction (RMSEP) used the four validation standards for predicting method robustness.
RMSEC and RMSEP values were 0.46% and 0.68%, respectively. Those values indicate that the method can easily predict the amount of pyrophosphate contamination in Na2HPO4 between 0 and 10.0% and be accurate, on average, to less than three-quarters of a percent.
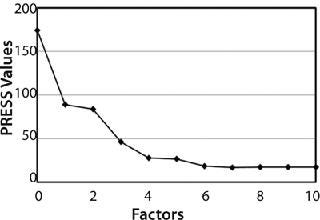
In addition to high correlation and low errors, a predicted residual error sum of squares (PRESS) plot provided for an evaluation of the quality of the method. Errors of an ideal PRESS plot decrease rapidly with increasing number of factors used in a method until it reaches a minimum and remains stable. Figure 3 shows that the PRESS plot for this method follows ideal form, indicating that the method is robust with good predictive capabilities. The method created for this chemometric analysis used four factors.
NIR Spectroscopy Advantages
NIR spectroscopy provides an advantage over standard laboratory chemical tests when implementing a QC procedure for analyzing and confirming raw materials in bioprocessing applications. It is a rapid, easily implemented technique that can be used directly on receiving docks and production facilities by people who are not technically trained to analyze quality of raw materials and product. Having this method in place enables pharmaceutical manufacturers to identify raw materials of low quality before use and prevent several million dollars in lost product and revenue.
Despite misconceptions that inorganic phosphate salts commonly used in buffers do not have sufficient signal to be analyzed with NIR spectroscopy, experimental data demonstrate that the technique can easily distinguish those materials from each other. There are clearly enough differences in the absorbing regions to identify and
classify incoming raw materials. The quality of refined Na2HPO4 can be monitored with respect to contaminating materials such as pyrophosphate. Specifically, this method can determine concentrations of contaminating pyrophosphate to within 0.68% quickly without taking the samples to a laboratory for expensive, time-consuming analysis.
About the Author
Author Details
Todd Strother, PhD, is an applications scientist at Thermo Fisher Scientific, 5225 Verona Road, Madison, WI; [email protected].
You May Also Like