Voices of Biotech
Podcast: MilliporeSigma says education vital to creating unbreakable chain for sustainability
MilliporeSigma discusses the importance of people, education, and the benefits of embracing discomfort to bolster sustainability efforts.
Osmolality and pH are important cell culture process parameters, key elements that are often examined and optimized to improve the productivity of cell-culture–based bioprocesses. Osmolality affects cell viability and growth by regulating the transport of water and nutrients through cell membranes and pH maintains the isotonicity of a culture. To monitor these parameters in cell culture, samples are typically withdrawn and passed through a multifunction analyzer as the BioProfile 400 instrument from NOVA Biomedical (www.novabiomedical.com). Withdrawing samples during a bioreactor operation can introduce contamination and lead to sepsis.
Osmolality is often determined using an off-line osmometer, and pH by potentiometric-based electrodes. Although in situ pH measurement is possible, it has some inherent technical challenges such as buffer precipitation and glass membrane cell clogging that reduce test result quality. Near-infrared spectroscopy (NIRS) offers an in situ, real-time monitoring capacity for both of these parameters without the problems associated with on-line pH measurement, providing a closed-loop culture feedback to adjust conditions for improvement of cell performance and productivity.
PRODUCT FOCUS: ALL BIOLOGICS
PROCESS FOCUS: PRODUCTION
WHO SHOULD READ: MANUFACTURING, PROCESS DEVELOPMENT, AND QA/QC
KEYWORDS: OSMOLALITY, pH, HYDRATED RADII, HYDRONIUM ION, PAT
LEVEL: ADVANCED
NIRS is an analytical technique based on absorption measured in the near-infrared region (700–2,500 nm) of the electromagnetic spectrum, which is located between the visible and the midinfrared. The fundamental absorption bands of functional groups occur in the midinfrared region, but the very strong nature of these signals usually requires dilutions to lower absorbances within the linear range of a midinfrared detector.
Overtone absorptions of those fundamental bands occur in the near-infrared (NIR) spectral region, occurring at frequencies some two or three (or more) times the fundamental or first excited vibrational state of the molecular bonds ((1). Because of the relative weakness of NIR absorption in organic solutions (such as cell culture suspensions), direct measurement is possible without sample preparation or dilution. These absorptions indicate the change of dipole moment in bonds and organic compounds that absorb well in the NIR region. OH, CH, NH, and SH bonds have the strongest overtone absorbances in the NIR region, where water has an extremely strong absorbance.
Figure 1.
PHOTODISC (WWW.PHOTODISC.COM)
Because NIR probes can be sterilized in-situ, they provide real-time aseptic sampling and measurements throughout mammalian and microbial cell culture processes (2,3). For the past decade NIRS has been used to provide real-time continuous data estimating the levels of glucose, lactate, and other culture media nutrients as well as metabolites. Additional analytes, even those that are not considered to have near-infrared signatures (e.g., osmolality and pH), are anticipated to be detectable by NIR technology in the near future. Here we describe our successful efforts to analyze both osmolality and pH with NIR technology, also describing its application in bioreactor-based cell culture process development.
Equation 1

Osmolality measures the number of moles per kilogram of substances that cause osmotic pressure in cell culture media. It is independent of both temperature and the amount of solute added (unlike osmolarity) because it is related to unit mass rather than unit volume. Osmolality measurement is performed to determine the concentration of inorganic salts present in a solution, ensuring proper cell viability and optimal cell membrane transport in cultures.
The pH value is logarithmic shorthand for specifying the number of hydrogen (H+) or hydronium (H3O+) ions per liter of a solution. A pH of 7.0 means that there are 10-7 mol/L of hydronium ions present. Pure water at pH 7.0 has an equal number of hydroxyl (OH–) ions as hydronium ions and is thus neither acidic nor basic.
During metabolism, mammalian cells produce lactic and carbonic acids that tend to drive the pH of their culture below 7.0. Cell lines thrive in different pH ranges, which may also depend upon the formulation of their cell culture medium. Most mammalian cells thrive in the 7.0–7.5 pH range, and it is important to keep their culture medium buffered at that optimum level. The pH is usually controlled by addition of sodium bicarbonate and CO2 ((4). Sodium hydroxide solution, which we used is this study, is another common choice.
The Inorganics Question: NIR spectroscopists often say that inorganic compounds are ill suited for NIR analysis because they lack the required change in dipole moment. Although that is true for solids to a great extent, aqueous solutions with salts represent a special case. When salts are dissolved in water and become ionized, spheres of hydration are formed around their positively and negatively charged ions with radii inversely proportional to the ions’ nonhydrated radii and directly proportional to their charge ((5,6). Such hydrated radii are predicted by the Debye-Hückel Equation (Equation 1), in which ? is the activity coefficient, z is the charge of the ion, is the ionic strength of the aqueous solution, and a is the effective diameter. A and B are constants with values of 0.5085 and 0.3281 at 25 °C.
The hydrogen ion (H+) is commonly denoted as associating with one water molecule and is thus referred to as the hydronium ion (H3O+). Actually, more water molecules are probably associated with the hydronium ion, increasing its sphere of hydration or effective diameter with a hydrated ionic formula of H9O4+ ((7). The hydronium ion is thought to be at the center of that structure, with strong hydrogen bonding to three other water molecules ((8).
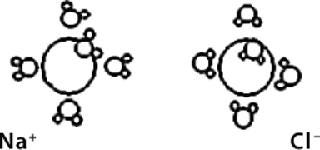
In the context of NIR analysis of aqueous ions, although they may not be detected directly by NIR absorbance, they can be detected and quantitated indirectly with the perturbation of water absorbance caused by the hydrated form. The Debye-Hückel Equation tells us that radius and charge of H+ ions will determine the number of water molecules and tightness (diameter) of related hydrated ions. Also, positive or negative charge will determine whether those water molecules are attached to the oxygen or hydrogen end (Figure 1). These binding differences lead to unique absorbances for each ion because of the perturbed absorbance of associated water molecules.
The exact position and nature of these absorbances are beyond the scope of our discussion here. A thorough study is required to precisely identify all sources of absorbance present in a complex matrix (a cell culture medium) with overlapping absorbance bands. However, partial least squares (PLS) loading plots permit identification of where the strongest correlated variance occurs.
Experimental
Cells and Cell Culture: We adapted an attachment cell line to serum-free growth conditions and then inoculated cells into a bioreactor at 2×10⁵ cells/ mL with 4 g/L of microcarriers. The culture grew for three days at 37 °C, with pH controlled at 7.10±0.05 using CO2 and base. We allowed dissolved oxygen (DO) to float down from an initial 100% to the set point of 50% air saturation by sparging pure oxygen through the culture. The agitation rate was set to 125 rpm. After removing ~80% of growth medium from the culture and replacing it with an equal volume of infection medium, we infected the cells with a virus at 0.01 MOI (multiplicity of infection, the ratio of infectious virus particles to cells) and then cultured them at 30 °C for nine days with agitation, pH, and DO controlled as before.
Bioreactor Instrumentation: A 0.75-in. (19-mm) diameter and 12-in. long interactance immersion probe was installed in a 3-L Applikon bioreactor (www.applikon.com) with a 1.5-L working volume. The adjustable–path-length probe was set to a 1-mm gap (and 2-mm path length) before the instrument was autoclaved. A FOSS XDS Process Analytics near-infrared spectrophotometer (www.foss-nirsystems.com) with a 3-m microbundle of optical fibers (40 for illumination and 40 for collection) was set up near the bioreactor. After the culture was prepared and the run initiated, we inserted those optical fibers into the probe already in place and sterilized.
On-Line and Off-Line Data Acquisition: For NIR data acquisition and analysis, we used Vision software from FOSS NIRSystems. All sample spectra were collected over the 800–2,200 nm range in interactance immersion mode. We averaged 32 spectra for the reference and 32 for each sample, with a scan time of ~16 seconds per spectrum. The XDS Process instrument uses a standardized internal reference loop that compensated for lamp variations throughout our 12-day cell culture. It collected scans every 15 minutes over the duration. We collected laboratory samples daily.
Laboratory pH values were determined by extracting a sample from the bioreactor and analyzing it using a BioProfile 400 system. We checked those values against a 405 DPAS-SC-K88/325 pH probe from Mettler Toledo (www.mt.com) in the bioreactor, and all were found to be within 0.05 and recorded to correlate with the NIR spectra. Laboratory osmolality was also determined with the BioProfile 400 analyzer, which calculates a first-order approximation of osmolality based on the measured ion concentrations of sodium, potassium, ammonium, glutamate, and lactate by the formula in Equation 2.
Equation 2

Results and Discussion
Osmolality: NIR spectra were mathematically pretreated before regression with the second derivative to enhance absorption bands and normalize spectra and the standard normal variate (SNV) to remove the baseline offset that comes from scattering. Because of the complexity of our growth media, we developed a PLS model. Strong absorption bands for water near 1,400 nm and past 1,770 nm were removed because the 2-mm path length caused them to exceed the dynamic range of the detector in those regions.
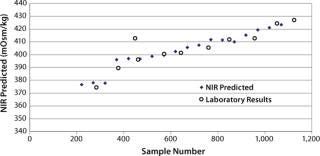
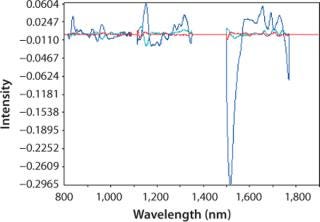
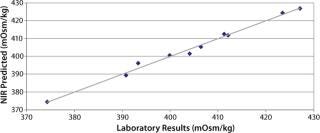
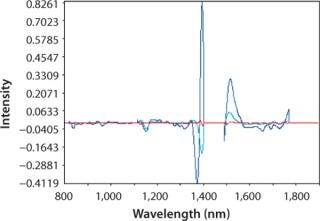
Figure 2 plots the process trend of osmolality over the course of a culture run, with laboratory osmolality data superimposed over NIR-predicted values. Figure 3 shows the partial least squares model loadings indicating where correlated variance is modeled between the laboratory data and the spectral absorbances. There is a large loading band at and around the first overtone of the OH stretch (at 1,400 nm), and smaller loadings are near 1,150 nm and 930 nm where OH is known to absorb. Figure 4 shows our calibration set, with NIR osmolality predictions plotted against laboratory data from the BioProfile 400 analyzer. Our osmolality model uses three factors and has an R2 value of 0.9905 with a standard error of 1.8825 mOsm/kg.
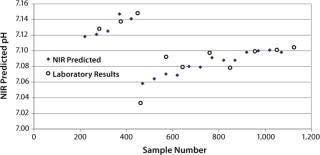
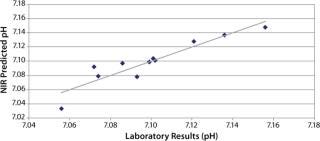
pH: We developed a model for pH with the second derivative and SNV mathematic pretreatments and removed the strong water absorption bands. Figure 5 plots the trend of NIR-predicted pH values over part of a culture run, with the measured pH values (laboratory data) superimposed. Figure 6 shows PLS loadings for this model. Again there are strong loadings around the first-overtone OH absorption band, but their character is significantly different from those for osmolality, which indicates no cross correlation. Figure 7 shows our calibration set with NIR predictions plotted against the laboratory pH data. Our pH model uses three factors and has an R2 value of 0.8729 with a standard error of 0.0134.
In Situ and Real Time
We found the real-time in situ NIR probe to track with the laboratory osmolality and pH of mammalian cell culture media. The ionic analytes would not be expected to have signatures in the near infrared, but NIR spectroscopy is very sensitive to aqueous ionic concentrations, most likely because of the perturbation of water absorbance bands. NIRS can monitor a bioreactor in situ and in real time, so it is capable of replacing or supplementing osmolality and pH measurements off-line or current on-line pH methods. So NIRS may be used to improve cell viability and productivity with closed-loop feedback.
1.) Smith, B. 1999.Infrared Spectral Interpretation, CRC Press, Boca Raton:14.
2.) Arnold, SA. 2003. In-Situ Near Infrared Spectroscopy to Monitor Key Analytes in Mammalian Cell Cultivation. Biotechnol Bioeng. 84:13-19.
3.) Mattes, RA. 2007. In Situ Monitoring of CHO Cell Culture Medium Using Near-Infrared Spectroscopy. BioProcess Int. 5:S46-S51.
4.) Mather, JP, and M. Tsao Lubiniecki, A. 1990.Expression of Cloned Proteins in Mammalian Cells: Regulation of Cell-Associated ParametersLarge Scale Mammalian Cell Culture Technology, CRC Press, Boca Raton:164.
5.) Purich, DL, and RD. Allison. 1999.Handbook of Biochemical Kinetics, Academic Press, London:184-186.
6.) Railsback, LB Some Fundamentals of Mineralogy and Chemistry.
7.) Brady, JE, and GE. Humiston. 1978.General Chemistry Principles and Structure, John Wiley & Sons, Inc., Hoboken.
8.) Zundel, G, and H. Butcher. 1968. IR-Spectroscopic Investigation of the Nature of the Groupings H5O2+. Z. Phys. Chem. 58:225-245.
You May Also Like