Voices of Biotech
Podcast: MilliporeSigma says education vital to creating unbreakable chain for sustainability
MilliporeSigma discusses the importance of people, education, and the benefits of embracing discomfort to bolster sustainability efforts.
High-throughput screening and process development methods are becoming more widely used in the biopharmaceutical industry. Recent development of high-expression (high–target-titer) recombinant culture methods has enhanced the need to also develop more effective separation products, methods, and processes (1). Part of the solution would be chromatographic resins offering higher capacities and flow rates.
However, developing an optimized purification process that involves several chromatographic steps can consume significant time and samples. In addition, a purification process developed at small scale often has to be further optimized before being used at larger scale. One strategy is the use of a platform approach (2,3,4,5,6), in which the need for optimization is fairly limited and only minor adjustments are necessary. Purification of monoclonal antibody (MAb) targets using protein A affinity chromatography as a capture step is an example that provides purified target material at high yields. The results can then be further purified using ion-exchange or other (e.g., mixed-mode) chromatography in bind–elute or flow-through operations.
PRODUCT FOCUS: MONOCLONAL ANTIBODIES
PROCESS FOCUS: DOWNSTREAM PROCESSING
WHO SHOULD READ: PROCESS DEVELOPMENT AND ENGINEERS, ANALYTICAL PERSONNEL, QA/QC
KEY WORDS: LABORATORY AUTOMATION, CHROMATOGRAPHY MEDIA, PLATFORM PROCESSES, HIGH-THROUGHPUT DEVELOPMENT
LEVEL: INTERMEDIATE
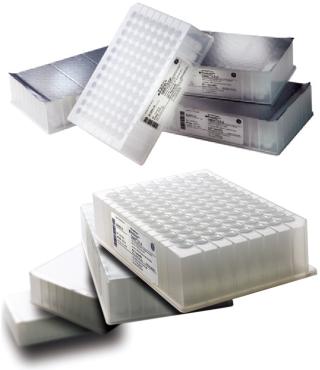
High-throughput techniques further speed up process development by providing increased variable testing and process understanding. Different miniaturized formats are used, one being the 96-well plate format (7,8,9,10,11,12). Using a parallel workflow, such plates provide high throughput, making it possible to screen a wide range of experimental conditions. Using 96-well plates is highly beneficial because they make it possible to develop an optimized purification process at an early stage with minimal sample consumption. Once a drug candidate reaches pilot scale, only obvious process adjustments should be necessary. In addition, a well-characterized experimental space provides in-depth knowledge about how process parameters affect product features required by regulatory authorities, supporting the quality by design (QbD) initiative (13).
Here, we show how high-throughput process development (HTPD) can be combined with a MAb purification platform consisting of MabSelect SuRe and Capto adhere resins from GE Healthcare to develop a purification process. The main purification challenge for the MAb we used was to reduce aggregate levels from ~13% to <1% while maintaining high monomer yield. Typical target levels in host-cell proteins (HCP) and in leached ligand are
Materials and Methods
The sample was clarified cell culture supernatant from Chinese hamster ovary (CHO) cells expressing a MAb with an aggregate level of ~12–14%. We screened chromatographic conditions in 96-well PreDictor plates either manually or using a Freedom EVO-2 robot with EvoWare Plus software from Tecan Group (www.tecan.com). In both cases, liquid was removed by vacuum. We analyzed collected samples collected by ultraviolet (UV) absorbance for product concentration and size-exclusion chromatography (SEC) for aggregate content.
Size-Exclusion Chromatography:
We analyzed monomer and aggregate content by SEC using two Tricorn 5/150 and Superdex 200 columns coupled in series on an ÄKTAexplorer 10 system from GE Healthcare equipped with an A-905 autosampler (15 min/sample analysis time). Monomer and aggregate peak areas were evaluated automatically for all 96 wells at 215 and 280 nm using a batch-run procedure in UNICORN software, version 5.01 (also from GE Healthcare).
Screening in PreDictor Plates: For the capture step study, we investigated the effects of MAb concentration in the feed and incubation time using PreDictor MabSelect SuRe 6-µL plates with a concentrated feed in 50 mM sodium phosphate and 0.15 M NaCl at pH 7.4. This study was designed to determine the effect of residence time on dynamic binding capacity (DBC). Figure 1 shows the plate layout used in the capture step studies. We predicted dynamic binding capacity using data obtained with the microplates according to a published method (7).
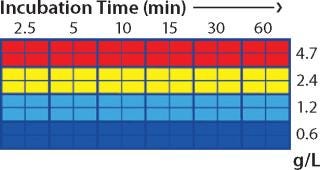
Figure 1: ()
We performed column verification runs using a 1-mL HiTrap MabSelect SuRe column (GE Healthcare) at 0.5-, 2-, 4-, and 8-minute residence times. We investigated elution conditions on MabSelect SuRe using PreDictor MabSelect SuRe 20-µL plates. MAb concentration in the feed was 1.1 mg/mL, and two sample loadings with an hour’s incubation time achieved a loading density of 22 mg MAb/mL media. In this experiment, we studied the following process parameters:
Buffer species (sodium acetate and sodium citrate)
pH 3.0–5.0
Buffer concentration (20 and 100 mM)
Additives (NaCl, 0–0.5 M; Arg, 2 M;
Gly, 0.2 M; urea, 2 M; and sucrose, 0.2 M).
We screened optimum conditions for the second step to be operated in flow-through mode on PreDictor Capto adhere 6-µL plates. This screening used the elution pool from a MabSelect SuRe column as a sample after adjustment of pH and concentration. Standard experimental conditions (e.g., MAb concentration and incubation times) were used for the flow-through experiment, performed at 5.3 mg/mL and one hour, respectively. Those were determined based on preliminary screening experiments (data not shown).
Other conditions tested included the following parameters:
pH from 4.0–7.5 (eight levels, rows A–H)
pH 4.0–6.0 with 50 mM sodium citrate
pH 6.5–7.5 with 50 mM sodium phosphate
NaCl concentrations 0–550 mM (12 levels, columns 1–12).
We calculated the concentration of monomers and aggregates in the starting material and the flow-through fraction from the peak areas associated with our SEC analysis. The starting material’s aggregate content was 13%. We calculated t
he binding capacities for monomers and aggregates — Qm and Qa respectively — using Equation
1, where Vsample is the volume of sample, Vmedium is the volume of chromatography medium, and Ci,m and Cm are initial and final concentrations of the monomer, respectively (or when calculating for aggregate capacity Qa, those of the aggregates).
Equation 1: where Vsample is the volume of sample and Vmedium is the volume of chromatography medium

Equations 2 and 3: where Vload is the volume of sample loaded onto a column, and CV is column volume (set to 10)


We predicted yield and purity that would be obtained in a packed column format at two sample loads: 130 and 260 mg/mL, assuming that capacities, Q (determined in plates), were equal to DBCs in a column. Thus, the monomer capacity (Qm) was equal to the DBC for monomer, and the aggregate capacity (Qa) was equal to the DBC for aggregates (most likely valid for longer residence times). We could then calculate purity and yield for monomer and aggregates using Equations
2 and
3 (similarly to our use of Equation
1), where Vload is the volume of sample loaded onto a column, CV is column volume (set to 10), and Ci,a is initial aggregate concentration.
Results from the flow-through experiment were verified using a 1-mL HiTrap column. It was equilibrated with 25 mM sodium phosphate at pH 7.5. Sample (desalted MabSelect Sure elution pool at ~7 mg/mL) was loaded at 10-min residence time.
Selective Elution Experiment: As shown in the results section below, our flow-through experiment did not result in sufficiently high yields. So we performed an elution study aimed at selectively eluting the bound monomer. We chose two promising binding conditions from the results of our flow-through experiment. Figure 2 shows the plate layout used. We used the same buffer type for binding and elution, with the first five rows containing phosphate and the last three containing citrate. In the flow-through experiment, we had found that the buffer type affected binding of the MAb to Capto adhere media. Thus, we ran pH 6.0 with both buffer species. In the elution study, we screened a pH range of 4.0–7.0 and NaCl concentrations of 0–550 mM (no replicates, Figure 2).
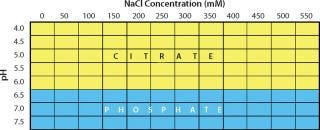
Figure 2: ()
We analyzed all three elution fractions, selected wells from the flow-through fraction (two samples for each binding condition), and the starting material by SEC. We used the product of monomer and yield (monomer purity × yield) to compare different elution conditions since the goal was to maximize both purity and yield, deeming the highest value as the best.
Column Verification: We ran a column experiment based on the results from our screening. The MAb was bound at pH 7.0 in 50 mM NaCl, 50 mM sodium phosphate (the same conditions as in the selective elution experiment). The first elution was with 200 mM NaCl and 50 mM sodium phosphate at pH 6.0. The second was with 400 mM NaCl and 50 mM sodium phosphate at pH 6.0.
Results
From our HTPD screening on MabSelect SuRe media, we predicted the DBC at 10% breakthrough (Figure 3, LEFT) according to a previously described method (7). After column verification, we compared the normalized values with the predicted values in Figure 3, RIGHT. The correlation was good, and we chose a residence time of four minutes for the capture step because the capacity increase with increasing residence time appeared to plateau at that point.
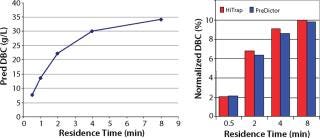
Figure 3: ()
From the elution study in PreDictor MabSelect SuRe 20-µL media, we found that none of the additives significantly improved monomer yield. Decreasing pH increased yield, but it also increased the aggregate levels. We found that the optimum for monomer yield was ~pH 3.6 in 20 mM sodium citrate. Figure 4 shows selected results from plate experiments showing conditions giving both high and low yield with data from corresponding column experiments.
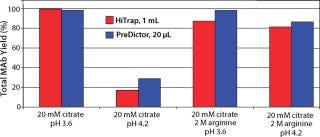
Figure 4: ()
In screening flow-through conditions for Capto adhere media, we found the highest capacity for both monomer and aggregates at high pH values and low NaCl concentrations. Because this step was evaluated as a flow-through step, our goal was to find a condition with an aggregate capacity much higher than its monomer capacity. Unfortunately, for all conditions the monomer capacity was higher than the aggregate ca
pacity (Figure 5).
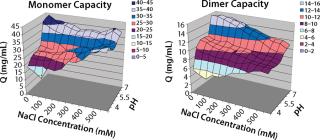
Figure 5: ()
Based on the capacity data, we could predict purity and yield for different sample loads for a column format and find the best conditions for the flow-through step. Figure 6 shows column predictions of yield (color map) and purity (isolines) at a load of 130 g/L of Capto adhere media. The trends in yield and purity appear to be inversely related. Yield improved with decreasing pH, whereas purity improved with increasing pH. Because we considered purity to be the most important factor in this flow-through step, we chose load conditions with the highest purity (the red box in Figure 6).
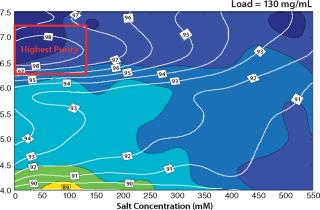
Figure 6: ()
Because the highest purity and lowest yield coincided with different conditions, we developed a selective elution step to maximize yield. Plate experiments looking at selective elution revealed that phosphate gave higher monomer levels in the elution pool than citrate did. We also observed that at pH 6.0–6.5 and moderate levels of NaCl (~250 mM), the elution pool had a higher proportion of monomer than aggregates. Column verification runs (Figure 7) resulted in an overall calculated step yield of 87% based on all fractions collected. Figure 8 illustrates monomer content of the different fractions (analyzed by SEC). As shown, the elution pool is very pure (99.5%), whereas the aggregate content of the discarded fraction is very high. HCP level was
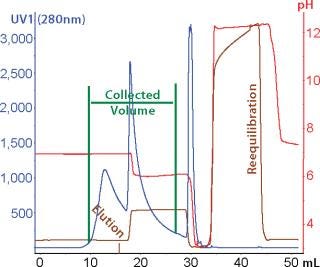
Figure 7: ()
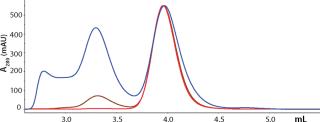
Figure 8: ()
Results Summary: For the MabSelect SuRe capture step, our HTPD experiments on binding conditions provided information about optimal residence time that matched column studies. Predicted DBC also gave information about a suitable sample load for the elution study performed in plates. That study showed that no additives were required. It was also possible to narrow down the range for elution pH.
For the second step, a flow-through step using Capto adhere media, data from plates predicted optimal conditions for both high purity (high monomer content) and high yield. Because coincident optimal conditions were not found, we aimed further HTPD experimentation toward optimizing a selective monomer elution step. Identified conditions were successfully verified in column studies that indicated a monomer content of 99.5% and yield of 87%.
High-Throughput Process Development
A good understanding for the two-step process was achieved from our plate experiments. Thorough knowledge of the effect of several experimental parameters increases the likelihood of developing a robust process with high productivity. MAb sample consumption during the development of this two-step process was minimized by the 96-well format. In addition, parallel workflow reduced the time spent on developing this two-step process.
PATENTS AND TRADEMARKS
“MabSelect SuRe Ligand Restricted License” and “Cys-rProtein A Ligand Restricted License” are protected by the following patents and equivalent patents and patent applications in other countries: US 5,151,350, US 5,143,844, US 6,399,750, WO 03/00475, and EP 1123389. A free, nontransferable limited license to use this product for internal analytical purposes accompanies the purchase of the product only from a GE Healthcare company and its licensed distributors. Any other use will require a separate license from a GE Healthcare company. The Tricorn column and components are protected by US design patents USD500856, USD506261, USD500555, USD495060 and their equivalents in other countries.
GE, “imagination at work,” and the GE monogram are trademarks of General Electric Company. ÄKTAexplorer, Capto, HiTrap, MabSelect SuRe, PreDictor, Superdex, Tricorn, and UNICORN are trademarks of GE Healthcare companies. All third-party trademarks are the property of their respective owners.
About the Author
Author Details
Corresponding author Carina Engstrand is a scientist, Gustav Rodrigo is a senior scientist, Annika Forss is a senior research engineer, Karol Lacki is a staff scientist, and Kristina Nilsson Välimaa is a research engineer at GE Healthcare, Björkgatan 30, S-751 84 Uppsala, Sweden; [email protected]
1.) Birch, JR, and AJ Racher. 2006. Antibody Production. Adv. Drug Deliv. Rev. 58:671-685.
2.) Slaff, G. 2005.Application of Technology Platforms to the Purification of Monoclonal Antibodies BioProcess International European Conference, IBC Life Sciences, Berlin.
3.) Sofer, G., and L.C. Chirica. 2006. Improving Productivity in Downstream Processing. BioPharm Int. 19:48-53.
4.) Shukla, AA. 2007. Downstream Processing of Monoclonal Antibodies: Application of Platform Approaches. Analyt. Technol. Biomed. Life Sci. 848:28-39.
5.) Ishihara, T, and T. Kadoya. 2007. Accelerated Purification Proces
s Development of Monoclonal Antibodies for Shortening Time to Clinic: Design and Case Study of Chromatography Processes. J. Chromatogr. A 1176:149-156.
6.) Low, D. 2007. Future of Antibody Purification. Analyt. Technol. Biomed. Life Sci. 848:48-63.
7.) Bergander, T. 2008. High-Throughput Process Development: Determination of Dynamic Binding Capacity Using Microtiter Filter Plates Filled with Chromatography Resin. Biotechnol. Prog. 24:632-639.
8.) Cramer, SM, K Rege, and J. Dordick. 2001.High-Throughtput Screening of Potential Displacer Molecules, Rensselaer Polytechnic Institute, Troy.
9.) Bensch, M. 2005. High-Throughput Screening of Chromatographic Phases for Rapid Process Development. Chem. Eng. Technol. 28:1274-1284.
10.) Charlton, H. 2006.Chromatography Process Development Using 96-Well Microplate FormatsBioPharm Int.
11.) Thiemann, J. 2004. Principle and Applications of the Protein–Purification– Parameter Screening System. J. Chromatogr. A 1043:73-80.
12.) Rege, K. 2006. High-Throughput Process Development for Recombinant Protein Purification. Biotechnol. Bioeng. 93:618-630.
13.) ICH Q8 (R2) 2006. Pharmaceutical Development. Fed. Reg. www.ich.org/LOB/media/MEDIA4986.pdf. 71.
You May Also Like