Voices of Biotech
Podcast: MilliporeSigma says education vital to creating unbreakable chain for sustainability
MilliporeSigma discusses the importance of people, education, and the benefits of embracing discomfort to bolster sustainability efforts.
Streamlining process development has been the focus of the biotechnology industry over the past several years. To be financially viable in the current market, a company has to be competitive in all three of the following areas: quality, speed, and price (1). Attaining any two of the three attributes at a time is no longer sufficient. With new tools and technologies along with improved understanding of the cell-culture process, doing high-quality process development while reducing both cycle time and cost is becoming a reality.
Effective process development must include accurate scale-down model(s) of the large-scale manufacturing processes. For most downstream unit operations, the important scale-up and scale-down considerations are understood; normalization of flow rates and column geometries at different scales are straightforward concepts to implement for purification operations. For bioreactor process development, however, the important factors such as mass transfer and mixing are more difficult to model. This paper describes our approach to bioreactor process modeling at Diosynth Biotechnology.
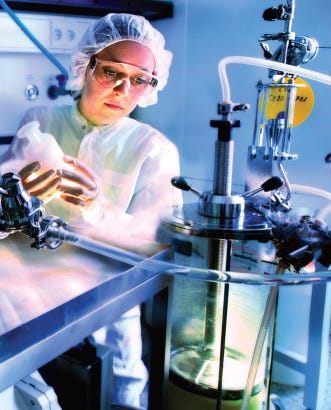
Figure 1:
A Sartorius Stedim Biotech UniVessel bioreactor like this one was used for the cell-culture process development described in this article (WWW.SARTORIUS-STEDIM.COM)
We have taken a three-pronged approach to cell-culture process modeling:
Use of small scale bioreactors
Use of mathematical modeling
Use of fractional factorial design of experiment (DoE)
Small-Scale Bioreactors
We have 16 × 2-L Sartorius UniVessel bioreactors, which are used for cell-culture process development. Our focus is to conduct rapid process development while generating material for purification and analytical development that is representative of the product to be produced at scale. Critical product quality attributes are very sensitive to bioreactor conditions (2). Development of downstream processes and analytical methods using product dissimilar to what will be manufactured is certainly not a useful exercise. Because cell-culture conditions determine for the most part the quality attributes of a product that is subsequently purified, all key and critical cell-culture process parameters must be controlled similarly at development and manufacturing scales.
We also have 8 × 15-L and 4 × 110-L Applikon bioreactors. The 15-L and 110-L bioreactors are used to demonstrate scalability before transferring the process to the 2,000-L scale at manufacturing. As Figure 1 shows, cell growth in the small-scale bioreactors match growth in 15-L, 110-L, and 2,000-L bioreactors.
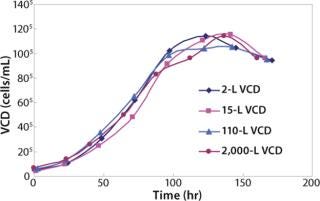
Figure 1: ()
Mathematical Modeling
We have characterized the oxygen mass transfer rates at the 2-L, 15-L, and 110-L scales. Because characterization studies at the 2,000-L GMP bioreactor scale are cost prohibitive, we developed a method to predict the oxygen mass transfer coefficient in the 2,000-L scale based on the oxygen uptake rate of a cell line in the scale-down model. Because KLa is vessel specific and is not dependent on cell line or process set-points, the KLa values generated for 2,000 L will be useful for all future projects at that scale. We describe our approach to predicting KLa at the 2,000-L scale in the following section.
We first determined the empirical KLa values at the 2-L scale using two different methods: static and dynamic (3). For the static method, we used a salt solution and sparged in nitrogen to bring the dissolved oxygen level close to zero. Then we sparged in oxygen at a given flow rate and calculated KLa based on change in dissolved oxygen level. For the dynamic method, we used a representative cell culture. We turned off sparge for a short period of time and overlaid the culture with nitrogen. As Figure 2 shows, the two methods generated proportional values. This result is in keeping with literature and prior experience (4). The static method used salt solution, and the dynamic method used cell culture in a complex basal medium. The difference in KLa values between the two methods is due to the difference in the broth properties. For each of the two sparge rates shown, the difference in the KLa values was calculated and the average of the differences was used as a proportionality factor for adjusting 110-L static KLa values (Figure 3).
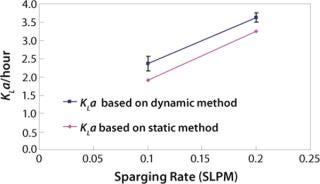
Figure 2: ()
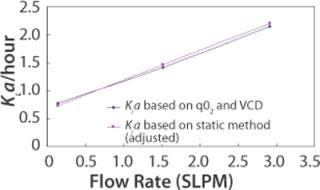
Figure 3: ()
A third method for determining KLa is through use of per cell oxygen uptake rate (qO2), which is a cell line specific parameter. Total oxygen uptake rate (OUR) is a function of qO2 and viable cell density (VCD). OUR can also be expressed as a function of KLa and oxygen concentration gradient. Therefore, qO2, VCD, and oxygen concentration gradient can provide sufficient information for KLa calculation. This method of KLa calculation was done for the 110L scale. Figure 3 shows that when KLa values from the static method are adjusted using the proportionality factor found from the 2-L bioreactor study, the 110-L KLa values from the two methods superimpose.
Figure 4 shows the predicted dynamic KLa values at different sparge rates at the 2,000-L scale.
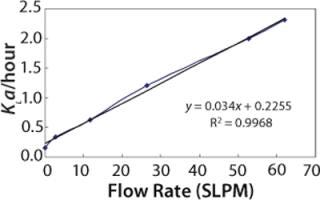
Figure 4: ()
We have done KLa studies at the 2-L scale for other purposes as well, such as to determine the impact of antifoam on KLa. Figure 5 describes a study in which 50 ppm Antifoam C (Dow Corning, www.dowcorning.com), was added on day 0 to the medium in the bioreactor. The control medium did not receive any antifoam. In this case KLa was determined using the static method. On day 0, KLa in presence of 50 ppm Antifoam C was substantially lower than in absence of Antifoam C. However, after two days, the Antifoam C containing culture had KLa similar to the control culture, indicating that the antifoam degraded or was sequestered during that time.
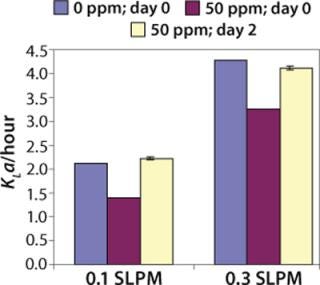
Figure 5: ()
Fractional Factorial DoE
DoEs allow simultaneous optimization of multiple factors (1). We use DoEs for all of our bioreactor studies and if possible for shake flask studies as well. Our clone selection and process development strategy is described in Figure 6. If a final clone has already been chosen by a client, then we focus directly on process development. The three sets of 2-L bioreactor studies use fractional factorial DoE models to maximize the number of factors that can be studied.
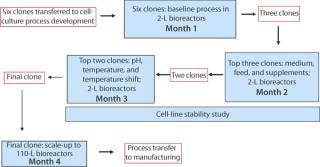
Figure 6: ()
We use the results from these DoE studies not just to optimize titer, but also to optimize product quality attributes. Figures 7 and 8 demonstrate two of the product quality attributes that we have analyzed and optimized for an antibody biosimilar project. Figure 7 shows LC-MS profiles of protein A batch captured product from four clones. It also shows the profile of a commercial batch of product. As shown by the green check marks and the red X’s, two of the four clones under the same process condition had more representative profiles than the other two. As a result, the two clones marked with the green check mark were moved forward for future studies.
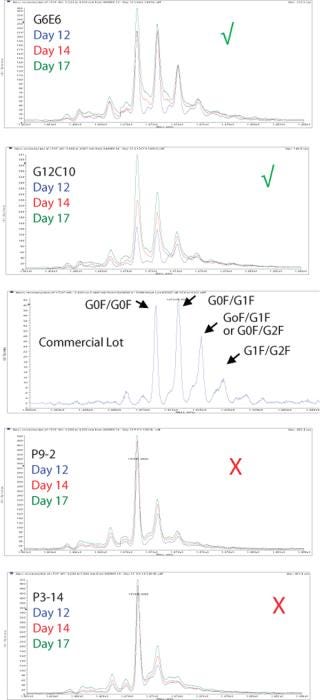
Figure 7: ()
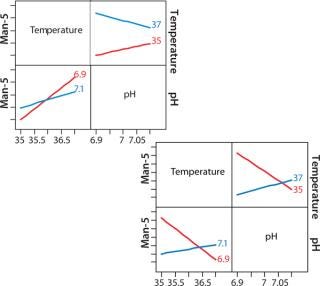
Figure 8: ()
Figure 8 shows a JMP interaction plot between two process parameters — pH and temperature — for two clones. The output measured in this case is mannose-5. Even though the two clones came from the same transfection, their responses to temperature and pH are very different. This type of analysis gives us an opportunity to achieve better product quality in a clone-specific manner while still maintaining a streamlined process development approach.
Future Direction
Incorporation of disposable bioreactors as seed and production vessels is one of our strategic goals. We plan to fully characterize these systems so that transfer of processes from stainless steel vessels to disposables or vice versa can be seamless. We are currently in the process of characterizing the BIOSTAT CultiBag 20/50 RM system (www.sartoriusstedim.com) and will soon acquire an Xcellerex XDR-200 disposable bioreactor (www.xcellerex.com). We also have a partnership with the North Carolina State University through which we have access to HyClone Single Use Bioreactors (SUBs, www.thermo.com). Preliminary work in the 50-L SUB has generated very favorable results. Currently, characterization of the 250-L SUB is ongoing.
1.) Condra, LW. 1993. Reliability Improvement with Design of Experiments, Marcel Dekker Inc., New York City:1.
2.) Mostafa, SS. 2008.. Development of a Cell Culture Process for a Biosimilar.
3.) Ozturk, SS, and W-S. Hu. 2005.Cell Culture Technology for Pharmaceutical and Cell Based Therapies, CRC Press, Boca Raton:276-279.
4.) Mostafa, SS, and X. Gu. 2003. Strategies for Improved dCO2 Removal in Large-Scale Fed-Batch Cultures. Biotechnol. Prog. 19:45-51.
You May Also Like