Voices of Biotech
Podcast: MilliporeSigma says education vital to creating unbreakable chain for sustainability
MilliporeSigma discusses the importance of people, education, and the benefits of embracing discomfort to bolster sustainability efforts.
April 1, 2014
The biopharmaceutical industry is facing many challenges. Global economic changes, increasing healthcare costs, expiring patents, and increasingly personalized medicine all affect the way manufacturers approach bioprocessing steps and the equipment and systems used to make biological drug products (1). Demands for smaller batch sizes, greater process flexibility, reduced manufacturing costs, and increased speed to clinic have driven the acceptance of single-use systems (SUSs) in this industry (Figure 1). SUS suppliers have rapidly developed components such as fittings, tubing, pumps, sensors, and flexible containers that are delivered to users presterilized and ready for use in single campaigns or process steps.


Applications such as buffer preparation and media storage were the first to adopt single-use components including filter capsules and plastic biocontainers. As single-use technology became accepted, it moved into upstream processes with the implementation of disposable bioreactors and mixing systems. The latest applications of SUSs are in downstream processes such as drug substance storage and final filling (2).
The benefits of single-use systems have been thoroughly investigated. Some key advantages over traditional multiuse systems include reductions in capital expenditure; smaller, more flexible manufacturing footprints; elimination of expensive clean-in-place (CIP) and steam-in-place (SIP) processes; reduction in cross contamination; and facilitated process changeovers. Along with those benefits, however, come new areas of concern associated with polymeric materials and disposable systems.
One area of interest is the cleanliness of SUSs. Because they are intended to be used “as-is,” the accountability for their cleanliness has shifted from end users to suppliers. Contaminants that are present in a given system — such as leachable compounds or particulate matter — may be transferred to process media. Contaminants in upstream SUS processes such as bioreactors and mixing systems pose less risk because process fluids will be subjected to downstream filtration and purification steps, which could remove such contaminants from the process stream. The closer SUSs are to final drug products, the higher the need is to reduce their leachables and particles. Clearly, final process steps such as drug-substance storage and final filling are high-risk activities that require the lowest levels of leachables and particulates in SUSs.
Particulates can come from many different sources. One source is the environment in which a drug product is manufactured: e.g., heating, ventilation, and air conditioning (HVAC) systems; tools and equipment used in the facility; and people supporting the manufacturing processes. Components and systems used to contain, mix, purify, and transport media throughout such processes present another source of particles. They include gaskets and seals, vials and syringes, and components making up SUSs such as tubing, fittings, and bags.
The primary reason to better understand and control particles in SUSs is to reduce their clinical impacts and ensure patient safety. If infused along with a biologic therapy, particulate matter can block blood vessels, affecting functional body systems to cause tissue damage and even internal organ failures. Particles also may be incompatible with a patient's arterial system, essentially poisoning him or her. Other potential effects include overtaxation of the immune system and reducing drug efficacy. Factors determining whether particles in a drug product will affect patients include the size, shape, and quantity of particles present; the composition of those particles; the dosage, frequency, and route of drug delivery; and patient attributes such as age and health status (3).
Secondary to the possible clinical impacts are commercial ones. Particulates may contribute to lower production yields and scrapped batches. The cost of goods sold (CoGS) is also negatively affected, increasing as the need for more risk-mitigation measures and quality assurance (QA) inspections. Additionally, companies may experience increased scrutiny from regulatory authorities. In one recent incident, 19 lots of drug product were recalled because of glass particles found in vials (4). That occurred even after several warning letters were issued by the US Food and Drug Administration (FDA) and expensive upgrades were completed for multiple facilities (4).
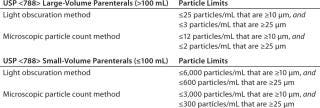
In an ongoing effort to mitigate particles, several regulatory groups have developed standards that are continually reviewed and updated by those same groups. Table 1 is a partial list of such standards. One commonly referenced standard is USP Chapter <788>, which establishes methods to quantify particles and provides acceptable limits for particulates in injections. Limits established in USP Chapter <788> depend on the method used (light obscuration or microscopic particle count) and whether a sample comes from a large-volume (>100 mL) or small-volume (≤ 100 mL) parenteral dose. Figure 2 lists those limits (5).

Regulatory standards focus on the quality and particle content of final drug products rather than the components and equipment used to manufacture those drugs. Filling that particle-source gap are industry organizations such as the American Society of Mechanical Engineers’ bioprocessing equipment group (ASME-BPE), the Bio-Process Systems Alliance (BPSA), the International Society of Pharmaceutical Engineers (ISPE), and the Parenteral Drug Association (PDA). The 2012 ASME-BPE Bioprocessing Equipment standard (6)is being updated for 2014 with addition of a section on particulates in single-use components. Similarly, BPSA is working on a white paper that will address control, testing, and evaluation of particles in single-use process equipment.
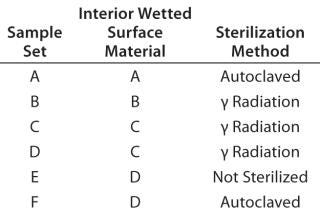
To better understand potential contributions of SUSs to the particle content of drug products, we evaluated several different single-use bags to quantify the number and size of particles present in each. We selected six different 1-L, two-dimensional (2-D) style bags from five different manufacturers for this evaluation. Those six bag sets included four different base-polymer materials for their interior wetted surfaces. Three of the six were gamma-radiation sterilized, two were autoclaved, and one was evaluated without sterilization (Table 3).
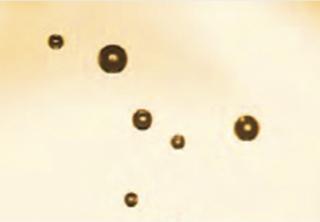
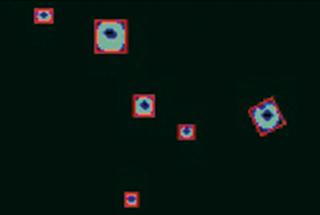
We used an in-line particle vision system to measure particles found in the samples. It uses high-intensity lighting to illuminate a flow-cell fluid stream. Opposite the fluid stream from the lighting system is a real-time charge-coupled device (CCD) camera that creates continuous high-quality digital images of the flow stream. Proprietary software then analyzes each image, breaking it down into individual pixels. Particulates going through the flow cell show up as dark pixels in each image (Figure 2). The software calculates each particle's major and minor axis, nominal diameter, and perimeter (Figure 3). Based on their nominal diameter, particles are allocated to integral size bins, each of which is tallied as the volume of fluid passes through the flow cell. For this analysis, we set the detection limit of the vision system to 0.7 µm, so it counted only those particles ≥0.7 µm.
The “Protocol” box lists steps used in testing each sample bag (Figure 4)
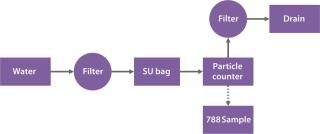
Figure 5 shows the average particles present in each milliliter from three replicate bags for each sample set. The data range from a low of 10 particles/mL for bag set F to a high of 447 particles/mL for bag set D. Multiplying the total volume of each bag by its particle density provides a total particle count range of 10,000 particles/bag (bag set F) to 447,000 particles/bag (bag set D). Bag sets A, E, and F generally had <100 particles/mL; bags B and C both had <200 particles/mL; and bag set D exceeded 400 particles/mL.
Connect bag to test-system plumbing.
Flush process line with ultrapure water through a 0.45-µm filter, bypassing the single-use bag.
Pump ultrapure water through a 0.45-µm filter into the single-use bag.
Manually agitate the bag by rotating it 15 times.
Dispense water from the single-use bag through the analyzer flow cell, recording particle count.
Pull two 50-mL samples from the effluent stream to be subjected to USP <788> testing.
Route effluent stream to drain through 0.45-µm filter.
Repeat with next sample.
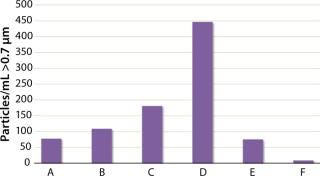
Figure 6 presents the particle density for each bag in our evaluation along with a breakdown of the particle-size ranges in categories aligned with the USP <788> criteria. Data also show variability within batches. Whereas two bags (D2 and D3) had high particle density in the 10-µm to 25-µm range, these data show that most particles found in single-use bags are <10 µm in size.
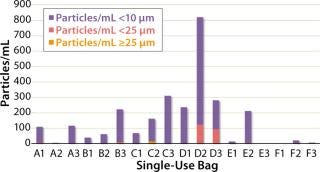
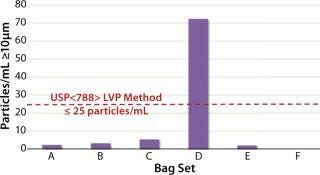
Figure 7 shows the average particle density ≥10 µm for each bag set. Those results demonstrate each bag's ability to support the requirements of USP <788>, which stipulates that a large-volume parenteral drug product (>100 mL) can have no more than 25 particles/mL that are ≥10 µm. The red dotted line on the chart defines that limit. Applying it to each bag set shows that only bag set D does not support the limits set forth in USP <788>.
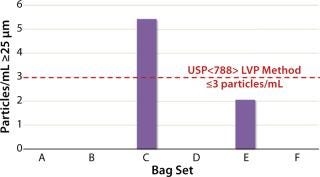
Next we applied the second USP <788> particle limit for large-volume parenterals. It stipulates that no more than 3 particles/mL can be ≥25 µm in size. Our test data (Figure 8) show that five of the six bags met this USP <788> criterion, with bag C exceeding the limit.
To correlate our data with an impact on final drug products, we pulled two 50-mL samples from the effluent stream from each bag, then combined and submitted those samples to a laboratory for testing according to the USP <788> protocol. They were evaluated using light obscuration, applying the criteria for large-volume parenteral solutions. Table 4 summarizes the results of this analysis, showing that samples pulled from all six bags met the acceptance criteria for USP Chapter <788>.

Finally, Table 5 summarizes our single-use bag particle data. It documents the sample-set variables of material and sterilization method, particle densities for the in-line flow cell as indicated by the vision-system results, particle densities as determined by the USP <788> light-obscuration method, and whether each sample's particle density passed or failed the USP <788> criteria.

As the bioprocess industry and use of SUSs continue to adapt and evolve, and regulatory agencies continue to hone associated standards, the particulate contribution of SUSs will be the focus of increased attention. Our intent in this evaluation was to understand the current state of particulates in single-use bags and their relationship to USP <788>.
Our results indicate a broad range of particle density in single-use bags from different suppliers, as well as inconsistency within batches. Of the 18 total bags we tested, most particles were <10 µm in size. When we applied USP <788> acceptance criteria to our in-line particle data, two of the six bags failed to achieve acceptance, whereas all the off-line light-obscuration samples passed the acceptance criteria set forth for injectables. Additionally, the in-line flow-cell analysis method showed higher particle densities for each sample set than did the light-obscuration method — in some cases over a 10× difference.
For end users, the level of risk associated with measured particulate densities in these bags can be determined only based only on the needs of specific applications and their acceptance criteria. For the industry as a whole, work must be done for us to better understand factors that affect particulates in final drug products. One of those might include the effect of sterilization methods on particulates: The three bag sets that had been exposed to gamma-radiation sterilization had the three highest particle densities. Materials of construction are another factor to further investigate: The two bag sets showing the highest particle densities had been constructed using the same polymer for their inner wetted surfaces.
We all must continue to quantify particle levels from complete SUSs and establish proper control steps. This will benefit the health of the industry overall and minimize risks for SUS users — and ultimately for patients as well.
Author Details
Michael W. Johnson is global bioprocess applications manager at Entegris, Inc., 3500 101 Peavey Drive, Chaska, MN 55318; 1-952-556-4085; [email protected]. Entegris is a registered trademark of Entegris, Inc. ASME is a registered trademark of the American Society of Mechanical Engineers Corp. And ISPE is a registered trademark of the International Society of Pharmaceutical Engineering, Inc.
REFERENCES
1.) Freissmuth, J 2013. Facing the Pharmaceutical Future. Pharm. Manuf.
2.) Martin, J 2010. Single-Use Technology. BioProcess Int. 8:64-65.
3.) Langille, SE 2013. Particulate Matter in Injectable Drug Products. PDA J. Pharm. Sci. Tech. 67:186-200.
4.) Palmer, E 2012. Hospira Blames Supplier's Bad Vials for Latest Recall. Fierce Pharma Manuf.
5.) Chapter <788> Particulate Matter in Injections Standard 2011.US Pharmacopeia– National Formulary.
6.) Standard BPE-2102 2012.Bioprocessing Equipment, American Society of Mechanical Engineers, New York.
You May Also Like